by Neil Kearney | Sep 20, 2011 | Boulder County Housing Trends, Statistics
I get curious about the real estate market too. I have a good view of what is going on from my “window” on the market. But sometimes I like to confirm what is going on by looking at the numbers. My feeling is that the market has been pretty slow since the beginning of August. The numbers confirm that it has been steady but slow with numbers comparable to last year at this time.
As I have stated recently when looking at the month end statistics, total sales are down approximately 7% but we have made big strides over the past two months in erasing that deficit entirely. Today I want to segment the market a bit more and look at the two statistics that I think best represent current activity in the market; under contract percentage and absorption rate (or inventory in months). I will look at each of these statistics over six price ranges and seven different geographic areas throughout Boulder County. If you are curious which price ranges or areas are selling the best, your curiosity will soon be quenched.
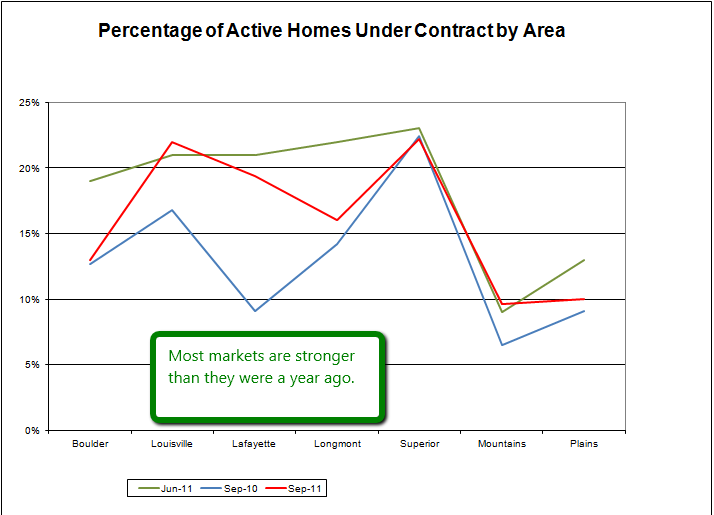
Let’s first look at under contract percentage. It is simply a quick ratio of the number of properties currently under contract to the total number of listings available. Here is a graph showing under contract percentage by area.
Under Contract Ratio by Area
Boulder 13%, Louisville 22%, Lafayette 19%, Longmont 16%, Superior 22%, Suburban Mountains 10%, Suburban Plains 10%
Compared to last year the under contract percentages are stronger in 5 of the 7 markets and almost equal in Boulder and Superior.
Under contract percentage arranged by price range is always interesting because the real estate market in Boulder County shows an almost linear increase as the price range rises. Or to say it another way, the market is more fluid in the lower price ranges and less liquid as prices rise. Here is how this looks.

Under Contract Percentage by Price
The numbers this year are very similar to last year at this time but are slightly higher which is good. The percentages range from 18% for properties listed up to $250,000 and 4% for those listed for more than $1.5 million. The lower price ranges have a balanced market and the upper price ranges show an over supply.
Tomorrow I will talk about absorption rate.

by Neil Kearney | Sep 8, 2011 | Boulder County Housing Trends, Statistics
Real estate sales in Boulder County continue to hold forward momentum. Early in the year sales were down as much as  22% from last year YTD. Now we are just behind by 7% overall. During August sales were 32% stronger than they were a year ago during August. This is a good sign that the momentum we have been riding through the summer is continuing.
Here are some quick facts:
- Total inventory is within 1% of where we were at this time last year. No stockpiling of listings here. Just ask an active buyer. They wish there was more to see. If you have been considering listing your home September might be a great time. Call me to discuss.
- Under contract percentage at the end of August was 15%.
- Sales under $500,000 over the past 6 months have decreased 7% from 2010. (1,902 sales)
- Sales $500,000 – $1,000,000 over the past 6 months have decreased 1% from 2010. (399 sales)
- Sales over $1,000,000 over the past 6 months are exactly the same as they were last year. (79 sales)
Please click on the slideshow below to view the monthly statistics graphically. For best viewing click on full screen in the lower right corner.

by Neil Kearney | May 26, 2011 | Boulder County Housing Trends, Statistics
The House Price Index report just released by FHFA.gov shows that home values in Boulder County decreased by 2.76% for the 1 year period ending March 31, 2011. This shows some deterioration in the general market conditions in Boulder since the House Price Index which reported on the period ending December 31, 2010. Real estate in Boulder County has been very resilient throughout the general housing downturn but it seems that some sellers are recognizing that a good price is the only way to reach buyers. FHFA ranks home appreciation in 309 market areas and Boulder is currently ranked 173rd. Last quarter we were ranked 87th. During the first quarter of 2011 FHFA reported a decrease in home values of 3.42% in Boulder County.
During the past year all homes in the United States depreciated 5.5%. Like Boulder this represented a step in the wrong direction in terms of appreciation. Values in Colorado dropped 6% and was ranked ahead of 16 other states (list includes Washington DC). According to the report, values in Boulder County have increased just .39% over the past five years.
Here are some positive things I see in the market going forward:
- As I mentioned in a previous post affordability is way up. Salaries have risen, prices have dropped on an adjusted basis and the cost to borrow money is down. This encourages buyers to make the move and encourages sellers to be realistic on the selling end in order to reap rewards on the buying end.
- Real estate in cyclical – one of the key indicators of a turning market is the lack of rental vacancies. It was reported this week that Boulder has the lowest vacancies in the state, just 1.6%. This will drive rents up and provide stimulus for renters to buy.
- We do not have an abundance of short sale or foreclosure inventory to work through. Right now in all of Boulder County just 6.7% of homes currently on the market are listed as distressed sales. This is very healthy and much better than the national average. In the City of Boulder this drops to 1.9% or just 21 homes out of 1,111 on the market.
- The market is still flowing. Currently 16.5% of listed properties on the market in Boulder County are under contract.
The most important thing to know is that transactions are happening every day. There are buyers looking at homes and all it takes is a seller who recognizes the market and can react to it by presenting their home as a good deal. I can help.
by Neil Kearney | May 19, 2011 | Boulder County Housing Trends, Statistics
Through May 18th, real estate sales in Boulder County are down 23% from the same period one year ago. On the surface that sounds really discouraging. Not the news one wants to hear when looking for any sign of recovery. But I’m here to give some perspective and some optimism to the numbers.
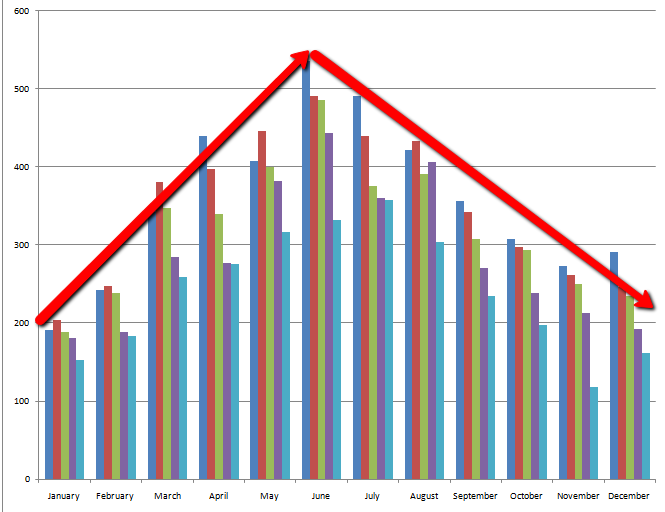
During most years our sales activity resembles a bell curve. Our low activity months are December and January and our months  with the most closings are May, June and July. It has been very consistent. The picture below shows sales by month 2004 through 2008. Notice the consistent pattern no matter the level of sales.
Last year (2010) our normal pattern was disrupted by the home buyer tax credit. The tax credit gave buyers an incentive to purchase a home during the first four months of 2010. The good news was that it worked. The bad news was that instead of starting a cascading sales effect, the credit just seemed to hurry buyers through the buying process. Once the tax credit expired our market slowed down considerably. The result locally was that instead of a nice bell curve, our sales activity resembled a shark fin.
So far this year we seem to be back to the old pattern. As I mentioned sales are down 23% so far this year, but here is the bright side. I expect that from here on out through the end of the year we will be eating in to that comparative decrease. Our slow start will resemble the tortoise in the fable “The Tortoise and the Hare”, slow and consistent.
Many of the leading economic indicators say that we are in a recovery period. So far this has not caught on in the housing sector. We have a lot of debris (foreclosures, negative equity, knee-jerk tight credit) remaining from the economic and housing collapse and I suspect it will just take time to work through those issues. In Boulder County we have less to work through. Fewer foreclosures, more stable housing values, a strong economy and an expanding job base. People are still moving into our area and that will ultimately be the engine to our ultimate recovery (click here for a post on migration patterns and home values).
Every week I track housing activity in Boulder County. I keep track of new listings, price reductions, contracts accepted and sales. We are just now starting to see the activity for this year overtake last in a few categories. If we were reading the story of the tortoise and the hare, this is the point where the hare is so far ahead that taking a nap seems like the best thing to do. From here on out I expect the tortoise to be making up ground. The chart below shows accepted contracts by year, 2011 in blue and 2010 in red. Stay tuned and be sure to cheer the tortoise on.

by neil kearney | Apr 14, 2011 | Statistics
The numbers for the first quarter in Boulder residential real estate sales and the findings are not all that surprising. Sales are down roughly 10.3% from last year. But before you get too worked up about another 10% loss in the market remember that last year our sales were overly active in the early part of the year because of the home buyer tax credit. Last year we had an unusually busy first few months only to fall off the cliff after the expiration of the stimulus. This year we are on a more traditional path. All price ranges are selling and our activity is actually pretty strong as a percentage of active homes that are under contract (over 20%). Inventory is down but we are seeing new listings on the market every day. We are in the midst of a good spring market we just have had a bit of a slow start. I am optimistic that 2011 will be a good year in Boulder real estate. To see the comparative statistical charts click on the presentation above. Choose full screen for best viewing.


