Through May 18th, real estate sales in Boulder County are down 23% from the same period one year ago. On the surface that sounds really discouraging. Not the news one wants to hear when looking for any sign of recovery. But I’m here to give some perspective and some optimism to the numbers.
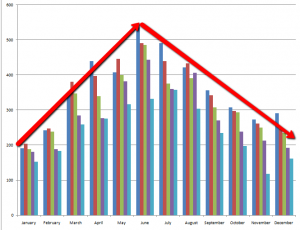
During most years our sales activity resembles a bell curve. Our low activity months are December and January and our months  with the most closings are May, June and July. It has been very consistent. The picture below shows sales by month 2004 through 2008. Notice the consistent pattern no matter the level of sales.
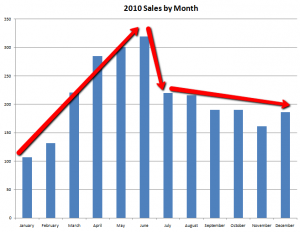
Last year (2010) our normal pattern was disrupted by the home buyer tax credit. The tax credit gave buyers an incentive to purchase a home during the first four months of 2010. The good news was that it worked. The bad news was that instead of starting a cascading sales effect, the credit just seemed to hurry buyers through the buying process. Once the tax credit expired our market slowed down considerably. The result locally was that instead of a nice bell curve, our sales activity resembled a shark fin.
So far this year we seem to be back to the old pattern. As I mentioned sales are down 23% so far this year, but here is the bright side. I expect that from here on out through the end of the year we will be eating in to that comparative decrease. Our slow start will resemble the tortoise in the fable “The Tortoise and the Hare”, slow and consistent.
Many of the leading economic indicators say that we are in a recovery period. So far this has not caught on in the housing sector. We have a lot of debris (foreclosures, negative equity, knee-jerk tight credit) remaining from the economic and housing collapse and I suspect it will just take time to work through those issues. In Boulder County we have less to work through. Fewer foreclosures, more stable housing values, a strong economy and an expanding job base. People are still moving into our area and that will ultimately be the engine to our ultimate recovery (click here for a post on migration patterns and home values).
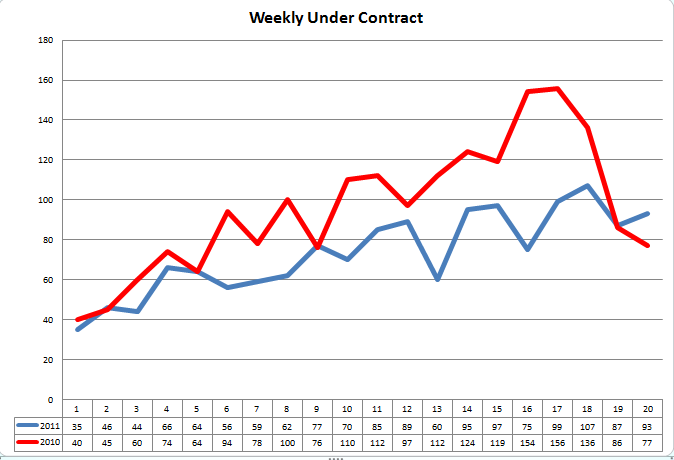
Every week I track housing activity in Boulder County. I keep track of new listings, price reductions, contracts accepted and sales. We are just now starting to see the activity for this year overtake last in a few categories. If we were reading the story of the tortoise and the hare, this is the point where the hare is so far ahead that taking a nap seems like the best thing to do. From here on out I expect the tortoise to be making up ground. The chart below shows accepted contracts by year, 2011 in blue and 2010 in red. Stay tuned and be sure to cheer the tortoise on.


