by Neil Kearney | Jan 10, 2013 | Boulder County Housing Trends, Statistics
2012 was a great rebound year for Boulder area real estate. Sales were up approximately 23% for the year. The improvement was across the board, each month of the year had more sales than the same month during 2011.
At the end of December we had 30% fewer listings on the market than we did at the same time last year. 34% of those listings are under contract. More inventory will be a key to the continued improvement of the Boulder area market in 2013.
by Neil Kearney | Oct 10, 2012 | Featured, Statistics
 The Kearney Report is the comprehensive guide to real estate in Boulder County. The report gives a detailed statistical view of the real estate market in Boulder County. The report includes detailed statistics on the county as a whole, The City of Boulder, Louisville, Lafayette, Erie,and Superior (as a group), Gunbarrel and Longmont. Please click here to view or download the report.
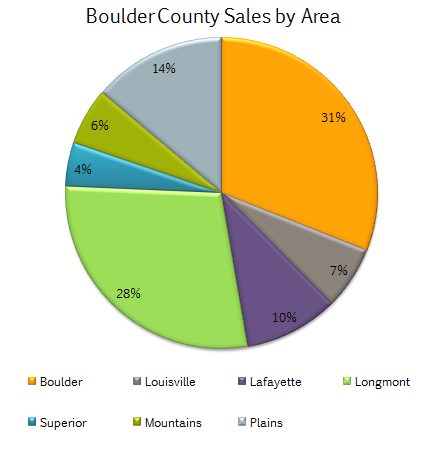
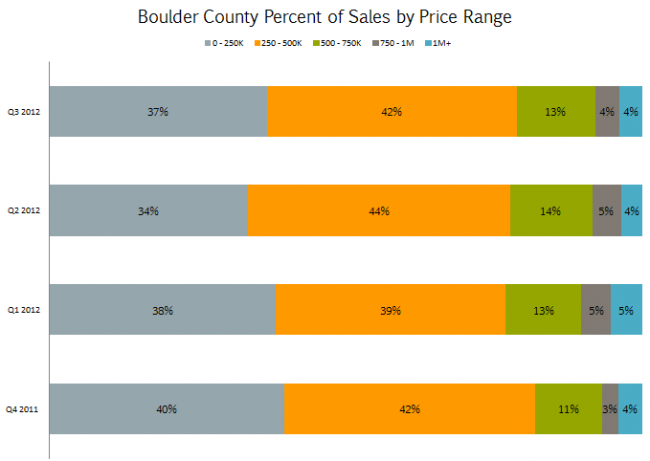
This report has more detailed analysis than any other report I have created to date. In the report you will find information on: price appreciation, total sales, number of sales by type (single family or attached) for each area, a breakdown of the percentage of sales in each sub area, percentage of sales by price range for each area, and five year price trends for average and median price. Along with the graphs I have written a commentary highlighting each category. It is fifteen pages in all. If you are interested in a comprehensive look at real estate in Boulder County, this is it. Here are a few graphs from the report.
by Neil Kearney | Sep 11, 2012 | Boulder County Housing Trends, Statistics
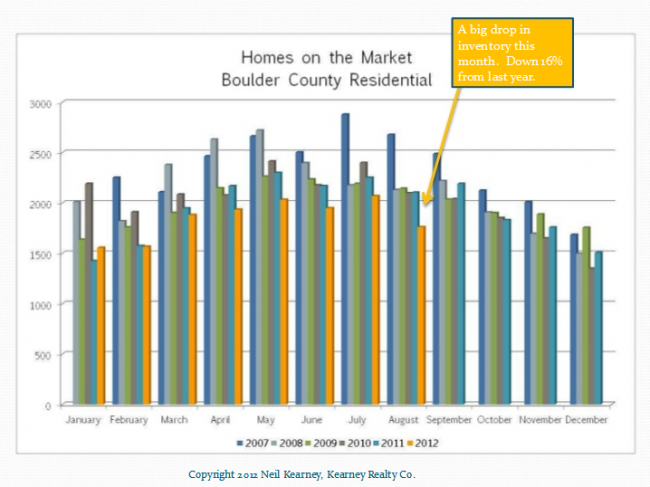
The market continued its strength in August in Boulder County. Sales of all residential properties were up by 15% during August (compared to same month last year). Year-to-date sales are up over 25% compared to last year. One of the biggest trends in the market right now is lack of inventory. The number of homes on the market in Boulder County is down 16% from the same time last year(see chart below) and the number of homes that are under contract are up 24% from last year. Both of these factors add up to a scarcity of listings and a strong market for those homes that are out there and well priced. Buyers are still hesitant to overpay for a seller who is not in tune with the market.
The slide presentation below gives a good overview of what has been happening in the Boulder County real estate market over the past four years. We have definitely turned a corner.

by Neil Kearney | Jul 24, 2012 | Boulder County Housing Trends, Statistics
In order to get a true picture of the current state of the real estate market, you must break it down into smaller segments. Looking closely at different price ranges gives a much more comprehensive and interesting view.
Under Contract %
<$400,000 33%
$400,001 – $600,000 27%
$600,001 – $1,000,000 19%
>$1,000,000 11%
U/C % shows the current level of activity in the market. Simply put, it’s the percentage of active homes on the market at any given time which have found a buyer. Clearly, the lower the price the more market activity there is.
Current Inventory in Months: (Using the past 12 months sales rate)
<$400,000 5.6 months
$400,001 – $600,000 6.9 months
$600,001 – $1,000,000 11.4 months
>$1,000,000 21.7 months
Inventory is a gauge of how long it would take to sell all homes in a given range if the past sales rate were to continue in the future and no new homes were to come on the market. Homes below $400,000 are in a healthy range, and those above $1 million are oversupplied given the current sales rate.
Sales through June 30, 2012
2011 2012 Change
<$400,000 1289 1,517 18%
$400,001 – $600,000 355 355 34%
$600,001 – $1,000,000 192 279 45%
>$1,000,000 68 93 37%
Sales were up across the board, but there is a direct correlation between the magnitude of change and the price range. It is interesting to see that a majority of the sales in Boulder County are below $400,000.
While the majority of sales in Boulder County take place below $400,000, the most improvement in the market was seen above $400,000. During the past few years the upper end of the market has really struggled. This year we are seeing some good improvement!

by Neil Kearney | Jul 10, 2012 | Boulder County Housing Trends, Statistics
“Our market will recover very quickly once buyers again decide to start buying again.”
“Affordability of homes, which is a function of prices and interest rates, is at levels we haven’t seen for decades. This area is poised for recovery and when it does improve, prices will increase.”
“Cautious Optimism – As we move toward recovery the number of listings is still low. Buyers are finding it hard to find the right home and there are more multiple offer situations. The market is not yet recovered but we are heading in that direction. Confidence in the market is key and if you are looking at the local real estate market your optimism should be rising.”
These three quotes were written by me six months ago. At that time the signs were in place for a good year ahead but after 3 years of a lackluster market it was hard to blow the trumpet too hard. After the first six months of 2012 it is clear that the market has gone through a major shift. We have broken a cycle. To read more about what the market has done over the past six months view the slideshow below.


