As of today home sales in Boulder County are up 24% for the year. At the same time inventory has been consistently low. These conditions have led to multiple offers in many cases. So the logical assumption would be that the average negotiation between buyers and sellers would have become smaller. Makes sense, simple economics. However, after looking at the numbers I am surprised.
Historically, the average negotiation off of the last list price of the property in Boulder County has been just under 3%. Here is a list of the average negotiation of residential properties in Boulder County for each year since 1999.
1999 – 1.37%
2000 – 1.36%
2001 – 1.76%
2002 – 2.41%
2003 – 2.83%
2004 – 2.66%
2005 – 2.44%
2006 – 2.77%
2007 – 3.15%
2008 – 3.23%
2009 – 3.80%
2010 – 4.14%
2011 – 4.11%
2012 – 3.16%* through June 27th
What I find interesting in the figures above are the macro trends in our market. Back in 1999 our area was one of the hottest markets in the country. Our appreciation (as measured by FHFA.gov) was ranked first in the nation, we were in the midst of a sellers market and the average negotiation off of list price was just 1.37%. During 2010 the number of sales had dropped by 40% from the peak in 2005, we had a negative appreciation (-1.9%, FHFA.gov), it was a full buyers market and the average negotiation was up to 4.14%. This year the market has showed some real improvement. We are ranked in the top ten in the nation for appreciation, sales are up 24% from last year and negotiation has fallen to 3.16%.
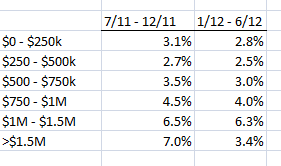
Delving more into the numbers I found that the difference in negotiation by price range is significant.
The simple table above compares the average negotiation by price range so far this year to the last six months of 2011. Overall sellers improved their negotiation range by around 1/2 %. This improvement held through most price ranges except for the luxury market over $1,500,000. In that segment 28 homes sold with an average negotiation of 3.4%. A huge improvement over the 7% that was recorded over the last six months of 2011.
It’s been very busy time in the Boulder real estate market (unfortunately not much time to update my blog)! Remember when a buyer needed to see a house the same day it came on the market? Well, we are back in that mode. Over the weekend I was working with two clients and both were interested in a property they viewed. Immediately after showing the properties and learning of my clients interest I called the listing agent to learn what I could about the situation. In both cases there was already an offer on the table and my clients had just a few hours in which to submit an offer in order to be considered equally with the first one. Talk about pressure.
The cycle for buyers is needlessly to say very fast. The cycle has also quickened for sellers. In the recent past, a seller would put their home on the market, wait a few weeks and see if anyone would come. Hopefully an offer would be made in a reasonable time like a month or two. Now if you don’t have multiple showings on the first few days (one recent listing of mine had 9 on the first day) you know that you either missed the price or that there isn’t much of a market for your home. If it isn’t sold within a few weeks your old news, hoping new buyers come to the market.
The graph below shows the last three years of market activity on a weekly basis. Specifically, it shows the number of homes that went under contract during each week. The green line is 2012 and shows a big breakthrough in activity. The red line is 2010 and shows the big spike in activity caused by the tax credit. We have now broken through that invisible barrier. How long will it last? I expect it to start slowing in June but the market conditions have definitely shifted.
The spring real estate market in Boulder is in full swing! In fact the market has swung so far that it must have had a big push! Sales are up 16.5% year-to-date in all areas of Boulder County and more impressively, sales improved 28.5% from last April. More importantly, the mood of the market has shifted. There is a buzz in the market. As an example, as I write this on Sunday night at 8:15, I just got a call from a Realtor whose client saw one of my new listings hit an internet site and she was afraid that she had missed something. I told her that it would be on the MLS by mid-week. She was relieved and was working hard to make sure that she was working for her clients. Buying a home right now in Boulder County is not just a once in awhile thing, it has to be an ongoing effort. In many market segments it’s a race.
The other eye-popping statistic in the slideshow above is that as of May 1st, 40% of the active listings in Boulder County already had an accepted contract. This is over double the rate of a normal/good market. Combine this with the fact that the number of listings is down 10% from last year, and you get a sense of lack on the part of buyers. This is good news for sellers.
The luxury market has largely not participated in the strong market activity this spring. As of today, sales are down 3 units year to date for properties over $1.5 million and just 8% of listings are under contract.
Now the true test of the market is the longevity of the strong market activity. I have been saying for over a year that there is pent up demand waiting for the time when the market is “good”. Maybe now is that time.
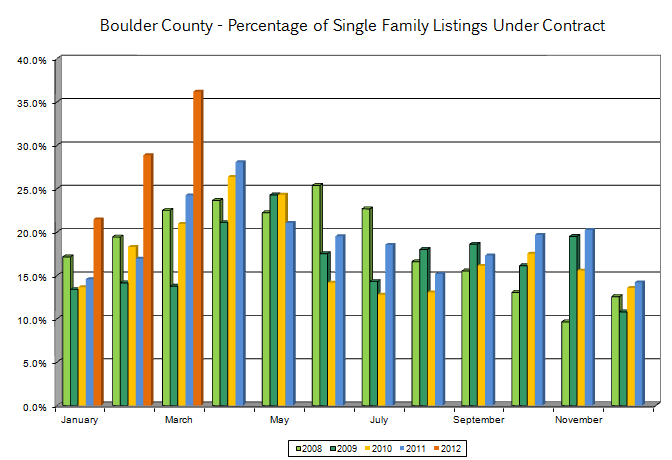
The Boulder real estate market is back in full swing. The best indication of the great activity that is happening is that 35% of the homes on the market in Boulder County were under contract at the beginning of the month. This is a huge number! As you look at the graph below, you will see that 35% is far and away the highest percentage of homes under contract over the last four years. Buyers are having a hard time finding exactly what they are looking for and when a really good house comes on the market it is not uncommon to have multiple offers coming to the seller in short order. The numbers for the market are all positive but what is most important to me is how the market feels. To me, this market feels much different than it has since the 2005 – 2006 market. There is a buzz out there and the people who I run into are echoing the increase in confidence and activity. It feels like we have made an important turn in the market! Year-to-date sales are up 10%. I expect this to increase throughout the spring. Inventory continues to lag and this is contributing to the feeling of scarcity that buyers are feeling. The graph below compares the number of listings that have come on the market on a weekly basis over the past three years. Even though the market is moving in a very positive direction the number of new listings is lower than 2011 and 2010. The short slideshow below shows the rest of the pertinent sales statistics for the Boulder County real estate market. I have annotated the slides so the rest of the story is contained below.