by neil kearney | Apr 29, 2015 | Boulder Real Estate
Boulder Colorado Neighborhood Profile
RED FOX HILLS
Boulder, Colorado 80301
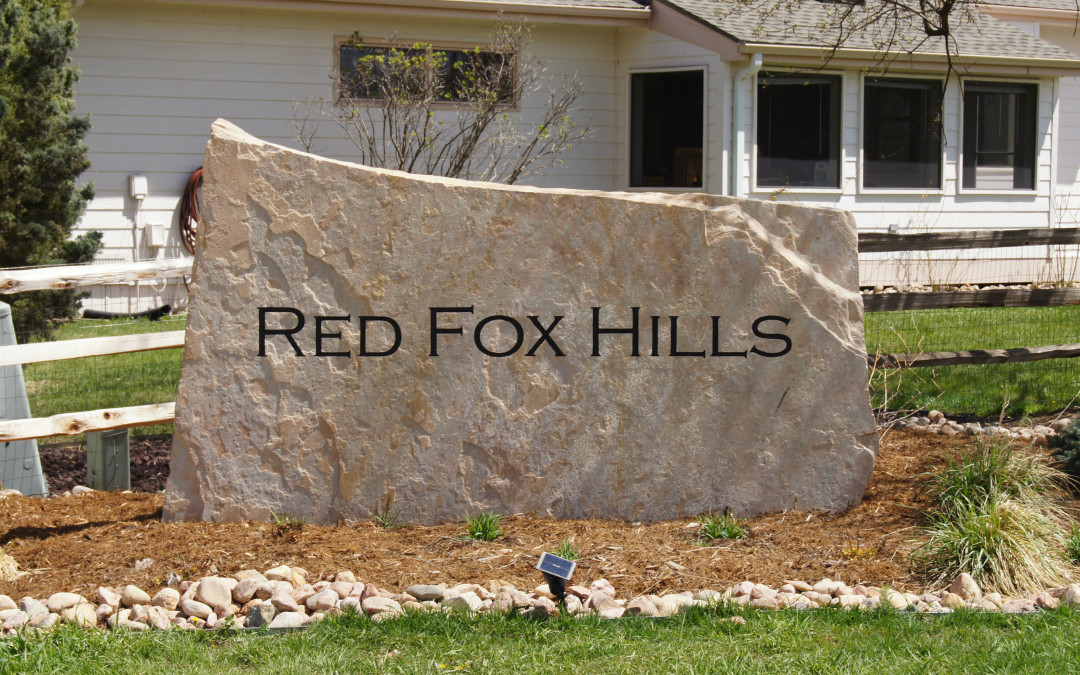
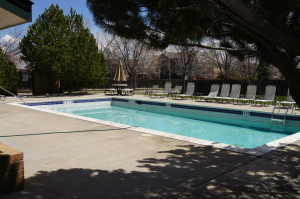
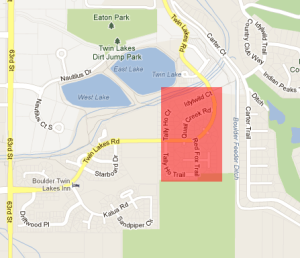
Red Fox Hills is a small neighborhood of 114 homes tucked into a quiet corner of the Gunbarrel area Northeast of Boulder. It is an especially quiet area, away from major streets and rail lines. It is surrounded by open space and many nights the only sounds you hear are those of the neighboring coyotes. The homes were built in the late 1980’s and early 1990’s by the local builder, Hudson Homes. One of the best features of this neighborhood is the proximity to Boulder County Open Space and trails. Many of the homes in the neighborhood back to open space and the trails around The Twin Lakes provide a great place to walk, run or view wildlife. One of the lakes has recently been designated an “off leash” area for dogs. The neighborhood is also known for its community activities such as a yearly progressive dinner and a community garage sale. It is also located near Boulder Country Day School and Mountain Shadows Montessori among others. The community pool is a great place to cool off, have a picnic and to meet neighbors.


Neighborhood Snapshot
- Number of Homes – 114
- Percent Owner Occupied – 95%
- Years Homes were built – 1985 – 1993
- Distance to Pearl Street Mall – 7 miles
|
| Schools
|
Neighborhood Amenities
- Surrounded by Open space
- Quiet Location
- Neighborhood Pool
- Large yards
- Friendly neighborhood activities
- Choice of High Schools
|

by neil kearney | Apr 14, 2011 | Statistics
The numbers for the first quarter in Boulder residential real estate sales and the findings are not all that surprising. Sales are down roughly 10.3% from last year. But before you get too worked up about another 10% loss in the market remember that last year our sales were overly active in the early part of the year because of the home buyer tax credit. Last year we had an unusually busy first few months only to fall off the cliff after the expiration of the stimulus. This year we are on a more traditional path. All price ranges are selling and our activity is actually pretty strong as a percentage of active homes that are under contract (over 20%). Inventory is down but we are seeing new listings on the market every day. We are in the midst of a good spring market we just have had a bit of a slow start. I am optimistic that 2011 will be a good year in Boulder real estate. To see the comparative statistical charts click on the presentation above. Choose full screen for best viewing.

by neil kearney | Mar 31, 2011 | Boulder County Housing Trends, Statistics
This is a really good question. It’s easy to talk in vague terms like; “it’s going pretty well” or  “inventory is down but sales are about the same”; but when you are looking to buy or sell a home in the Boulder area it is nice to have more detailed information. If that sounds interesting to you here is the information you are looking for. The slideshow below (which can be found here) has seven charts. Each showing a different facet of the market. I will explain the charts below in order.
- This chart shows the number of sales which have happened on a weekly basis in Boulder County over the first 13 weeks of the year. The blue line shows the activity in 2010 and the red line shows the activity so far this year. Each point on the graph shows one weeks worth of activity. So far this year there have been 60 fewer sales or a decrease of 8%. This is not unexpected since last year the early year numbers were enhanced by the tax credit.
- The second chart shows the number of properties that have gone under contract on a weekly basis. It compares last year to this year, again for the first 13 weeks. This one is very interesting. The number of contracts written and accepted is down 23%. It will be interesting to see how the sales come out over the next few months.
- The number of new listings follows the same pattern as last year (interesting!) but we are seeing fewer homes hit the market. There is a noticeable decline in homes on the market.
- The next chart shows the percentage of homes that are under contract in the main areas of our local market. It compares March 2011 to three dates last year. One in May, one in September and the last in December. The higher the number of homes under contract the better and we are a bit behind last May in most areas but ahead of September and December. Keep in mind that the percentage looks better when there are fewer homes on the market, like there are right now.
- The next chart shows the percentage of properties that are under contract classified by price. I love this graphic because it really shows the price gradation in our market. The higher the price, the tougher it is to sell.
- Inventory is a measure of how many months it would take to sell all of the current listings in any given area or price range. This chart shows the inventory for different areas around the county. It is interesting that things haven’t changed much over time. Louisville still has the shortest inventory and the mountains still have the longest inventory.
- The last graph shows the inventory by price range. There is a definite trend here. As price increases the expected time to sell, or the flow in the market decreases.
In general, showing activity has been very strong but buyers tend to be very selective and are looking at many homes before writing an offer. It is common that buyers put in a low offer to give themselves the best chance to negotiate the best deal. Needless to say this is not too popular with sellers. If you are looking for professional representation give me a call, I’d love to be of service.
by neil kearney | Mar 22, 2011 | Listings
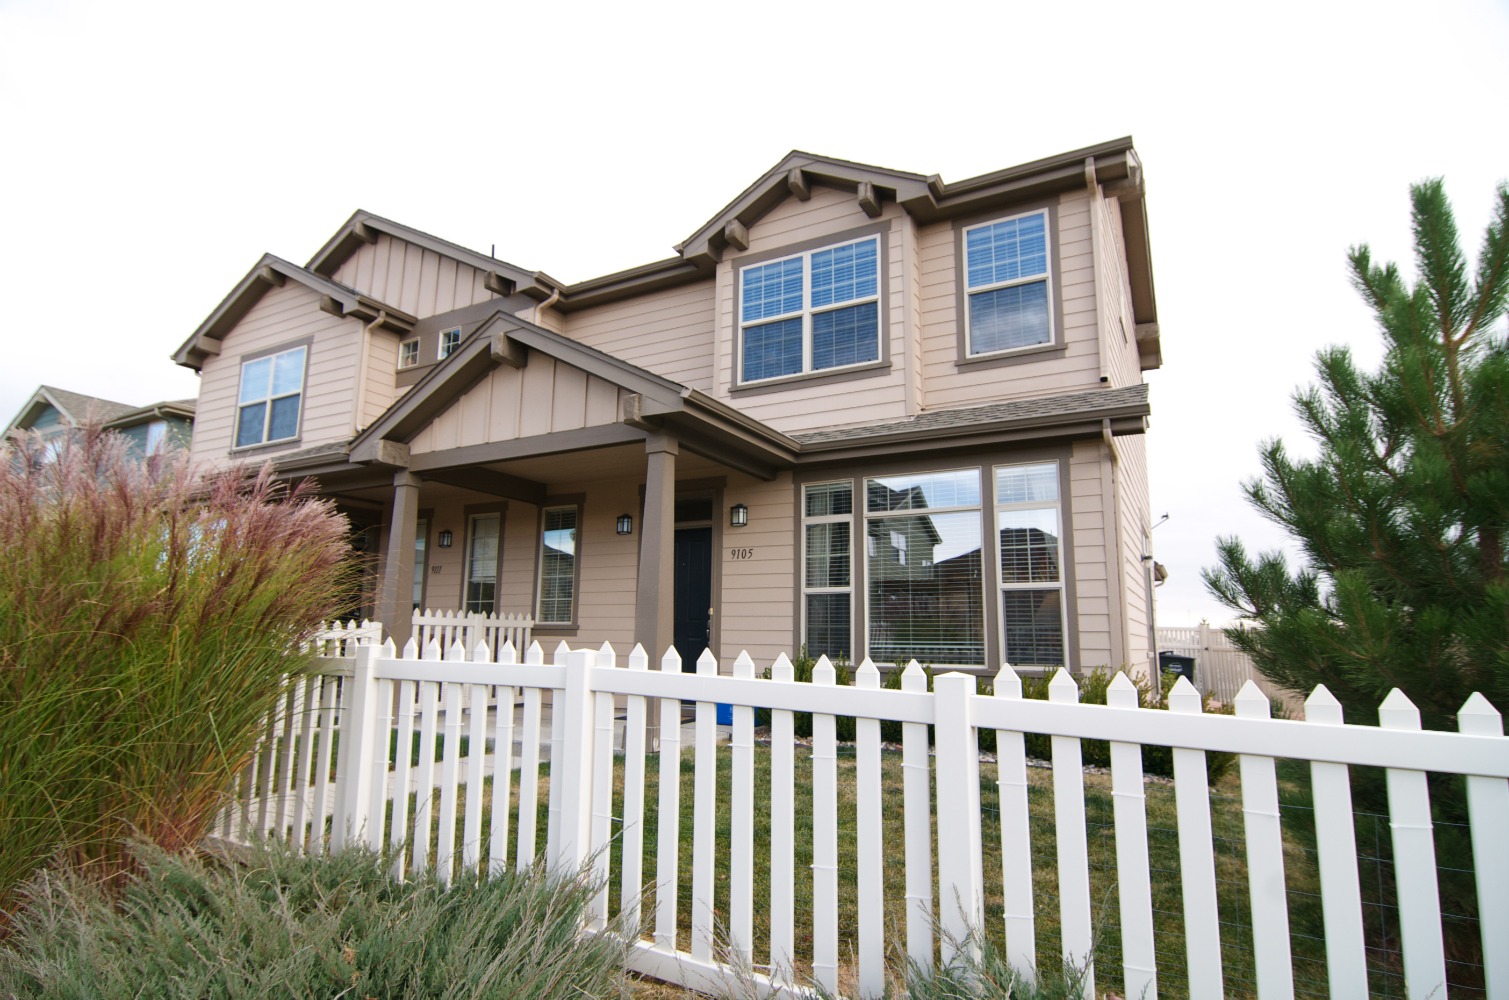
For more details on this listing go to www.9105W107th.com
9105 W. 107th Place Westminster CO 80021 – $210,000
If you are looking for a comfortable place to call home, look no further. When you compare the size, location, amenities and quality,  this is a great value. This 1/2 duplex is located at the end of a cul-de-sac and has a back load two car garage. It also has a large, private, fenced yard which is rare for an attached home. Inside you will find large rooms and nice quality finishes. On the main level you will find a kitchen and dining area with gleaming hardwood floors, a bright family room, a large bathroom with full size laundry facilities and access to the large two car garage which has plenty of storage and is beautifully upgraded.?
Upstairs you you find two very large bedrooms, two full bathrooms and a bonus office area with a built-in desk and shelving. The home has air conditioning and has been really well maintained. This is a quality place to live and I’d love to show it to you. Please give me a call for a private showing.

by neil kearney | Mar 8, 2011 | Boulder County Housing Trends, Statistics
Some years the “bang” of the new year means a quick start in the Boulder real estate market. Other years we get off to a slower start. This year it has been somewhere in between. If my activity is indicative to the market as a whole I could infer that we are gearing up to a fairly decent year. Many more people are thinking about making a move this year than have in the past two years. It just feels different. It feels good that people are back in the market.
However, this doesn’t mean that it’s 2005 all over again. The market has changed. Buyers are more cautious, sellers need to be realistic in order to sell and we as brokers try to keep everyone moving in the right direction. Not always easy.
Now to some facts. I track market activity on a weekly basis. Every Thursday at 8:30 I pull a report and record the results. I track market activity on a weekly basis in Boulder County. I track new listings, price changes, homes that went under contract, homes that sold and the median price of those sales. Over time the trends are quite interesting. I have been doing this for almost two years now.


