by Neil Kearney | Dec 4, 2014 | For Buyers, Real Estate 101, Statistics
 Most real estate buyers can’t afford their home. A first time buyer who saves up for a down payment, has good credit still can’t afford their home. Being able to afford their home means paying cash. When a buyer says that they can afford a $300,000 home for example what they actually mean is that their budget allows for them to afford the payment on the mortgage that goes along with a purchase price of $300,000.
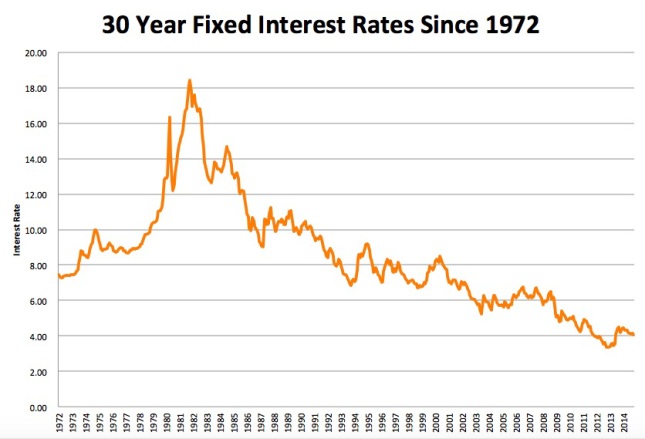
When a buyer is in the market for a home, the search process is usually short enough so that the mortgage interest rates are relatively stable. But this is not always the case. For a long time now, interest rates have been historically low but as you can see from the attached graph they are still historically VERY LOW. At a recent meeting I attended, the Chief Economist of the National Association of Realtors predicted that interest rates would rise .5% by spring and be up near 6% by the end of 2016. These are big jumps in a market where we have gotten very used to low rates. I fear that many potential buyers are beginning to expect the rates to stay where they are. And I hate to be the bearer of bad tidings, change is the only constant and the cycle for increasing interest rates is coming. When I broke into the real estate business as a green agent in Boulder Colorado in 1992 8% was a great rate. Now 4% is considered a great rate.
So when interest rates do go up the issue will not be how expensive a house you can afford, it will be how big a payment a buyer can afford. So, let’s look at how sensitive a payment is to changes in interest rates. This is called payment elasticity. Let’s consider the following scenario.
- A buyer has been pre-qualified for a mortgage payment (not including taxes or insurance) of $1800 per month. Let’s assume a current interest rate of 4.5%, at this rate they qualify for a top home price of $355,000.
- They are excited about their home search and on their first time out with their Realtor (hopefully me :)) they see some really great homes. They are happy with the type of home they can get, but decide to keep looking.
- They have a trip planned and then people coming into town, so they are not able to look at homes for a number of weeks. After that they find that there isn’t much to look at. The time between first looking at homes and their second viewing trip is two months. During that time interest rates increase from 4.5% to 5%. The next time out they find a house listed for $355,000 and write an offer for $350,000. The offer gets accepted and everyone is really excited until they talk to their lender who informs them that “interest rates have increased and they can no longer qualify for the house they have a contract on. Their top price range is now $335,000”. Crushed! Disappointed! Upset! Betrayed! These are just a few words that come to their minds as they quickly cancel the contract.
It’s called interest rate risk and it can really happen. In my scenario, the buyers lost $20,000 of purchasing power in a short amount of time as interest rates climbed just 1/2%. To see how this looks with real payments take a look at the chart below. In this scenario for every 1% increase in interest rates they lose $40,000 of purchasing power. If in our scenario the buyers find a way to qualify their payment just went up $106 per month or
 Moral of the story – Don’t ignore interest rates. If you are happy with your payment and happy with a house, jump on it. This could become an issue in the near future.
My source for the historical interest rates is FeddieMac

by Neil Kearney | Nov 13, 2014 | Boulder County Housing Trends, Statistics
The real estate market in the Boulder area was a bit sluggish in August. But once school started there was a surge of activity. The showing and contract activity in September led to a nice increase in closings during October. In fact sales were up 12% from a year ago. Home inventory remains low and year-to-date sales are down roughly 5% from a year ago but 6% above 2012. The quick presentation below shows the market in graphs, comparing the last four years of data on a monthly basis.

by Neil Kearney | Nov 3, 2014 | Boulder County Housing Trends, Statistics
 I have just completed The Kearney Report for the 3rd quarter. The Kearney Report is a comprehensive, quarterly presentation of the real estate statistics in Boulder County. I then break it down into smaller areas so that we can identify differences within the Boulder area real estate market.
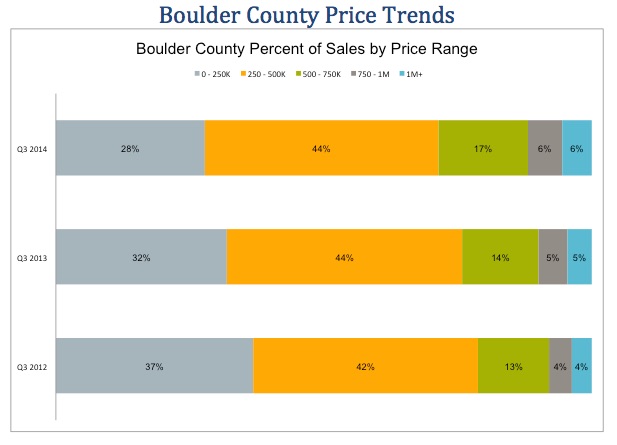
Through the first three quarters, total sales in Boulder County are down 6% from last year but up 6% from 2012. However, the sales volume is down just 2% YTD. This means that the average price for each home sold has increased. This increase has come in two forms. First, the median home price increased by 8% from the third quarter of 2013 and secondly, more high priced homes have sold this year. Last year 24% of all sales in Boulder County sold for $500,000 or more. This year it’s 29% above that threshold.
So far this year there have been 1,557 sales in Boulder County. Here is where those sales have taken place:
City of Boulder – 43% (478 sales)
City of Longmont – 39% (432 sales)
Unincorporated Plains (including Gunbarrel and Erie) – 21% (231 sales)
City of Lafayette – 16% (177 sales)
City of Louisville – 8% (92 sales)
Unincorporated Mountains – 8% (84 sales)
Town of Superior – 6% (63 sales)
Prices have been rising and it’s interesting to see the erosion of the lower end of price spectrum and the expansion of the higher end of the market. The chart below shows that in the third quarter of 2012 79% of the home sales in Boulder County closed for $500,000 or below. This most recent quarter 72% sold for under $500,000, an erosion of 7%.
To view and/or download the entire Kearney Report for the 3rd Quarter of 2014 which includes 15 pages of detailed charts and analysis click here.

by Neil Kearney | Oct 14, 2014 | Boulder County Housing Trends, Statistics
The real estate market in Boulder County has had a nice surge of activity this fall. There is a small uptick in new listings, a strong increase in under contract percentage and the title companies were very busy at the end of September. Sales for the year are still down 6% from last year. The presentation below shows the most recent month compared to each month over the past five years in number of sales, inventory of listings and under contract percentage. Also presented are the number of homes that have gone under contract on a weekly basis, new listings on a weekly basis and sales on a weekly basis over the past four years.

by Neil Kearney | Sep 25, 2014 | Boulder County Housing Trends, Statistics
It was clear that prices were rising this spring. There were tons of homes selling for full price or above and it seemed each sale was breaking new territory. Buyers felt it as “that one” deal got away and never came back around. Sellers felt it as they sold for higher than the had imagined just months earlier. But this is all anecdotal. Hard figures were hard to find and month to month numbers are much too volatile to be trusted. I’ve been tracking the FHFA.gov home price statistics quarterly since 2006 and they give a stable platform from which to compare prices. Not only in our market but across the county. Here are the latest home appreciation results from the second quarter of 2014.
For the one year period ending June 30th homes on average increased in value by 9.6%. This is the highest figure since 2006 and ranked us 55th highest out of the largest 276 metropolitan areas. During the second quarter the appreciation rate in our market was 3.81%. This ranked 33rd highest nationally. Since the 2nd quarter of 2008 homes in our market have appreciated on average 13.7%. This is 21st best in the nation. The chart below shows the rolling one year appreciation of Boulder County compared to the United States as a whole over the past five years.
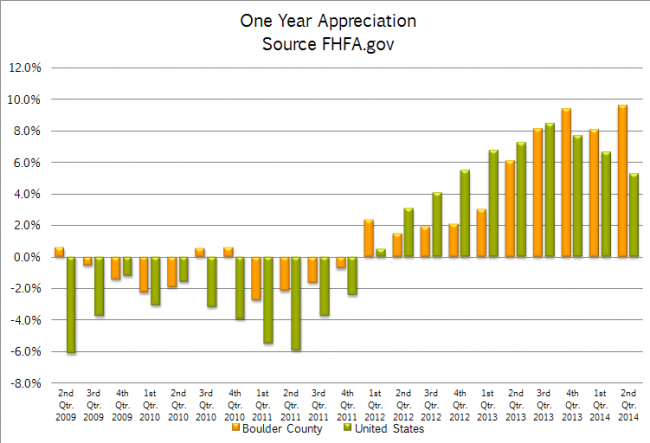
The one year appreciation in the United States as a whole has slowed a bit but at 5.25% is still historically quite strong. However during the second quarter the appreciation was just .81%. Over the last five years the national housing stock has appreciated in value by 8.25%.
The top states for home appreciation right now are; Nevada (14.8%), California (11.38%), District of Columbia (10.74%), North Dakota (8.68%) and Arizona (8.39%). Colorado ranks 8th with 7.76%. The states that rank lowest in home appreciation are Mississippi (-.51%), Connecticut (.29%), Alaska (.34%), Delaware (1.13%), and Virginia (1.24%).
The top Metropolitan Areas for home appreciation are all in California and all showed gains in the 22 – 25% range. These are the same areas that were hit the hardest during the economic and housing crisis but now have recovered and are now positive for the five year period. The areas that have the lowest appreciation (-3.5 to -2%) are located in Ohio, Wisconsin, New Jersey, Illinois, and New Mexico.

by Neil Kearney | Sep 11, 2014 | Boulder County Housing Trends, Statistics
The market slowed during August. Sales were down roughly 15% from last month and 14% from last August. Sales are down 7% year-to-date. These sales numbers reflect the closings during the month so most of the contracts were written in July. The contract activity as measured by the number of homes that went under contract during the month continued to slide in August. The inventory of available homes continues to be low. The fall in activity and the low inventory keep the overall market in the sellers favor.
We usually see a nice surge of activity in September and October before slowing again for the holidays. The slideshow below includes more data and charts regarding the market.