by Neil Kearney | Aug 24, 2014 | Boulder County Housing Trends, Statistics
Through July sales of residential real estate in Boulder County is down roughly 5% from a year ago but it’s the second best year since 2007. The recovery is holding. For the month of July the numbers reflected this larger trend, down 4.5% from July 2013 but higher than any other July dating back to 2005. With low inventory and very little negotiation off of list prices, it has definitely been a sellers market this year. While it’s hard to measure price changes on a monthly basis (due to changes in the mix of sales) prices are definitely heading up. Browse through the slides below to get a visual tour of the market conditions.
by Neil Kearney | Aug 18, 2014 | Boulder County Housing Trends, Statistics
 I have just published The Kearney Report for the 2nd quarter of 2014. This 17 page report gives a detailed view of the real estate market in Boulder County as a whole as well as a view of each of the communities within the county.
To view or download the report for free click here. Kearney Report 2nd quarter 2014
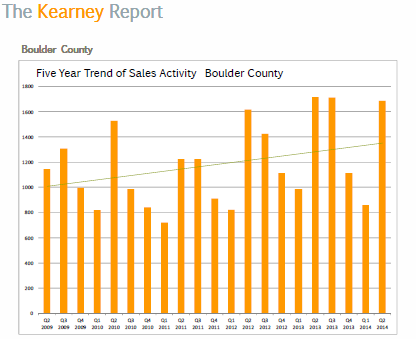
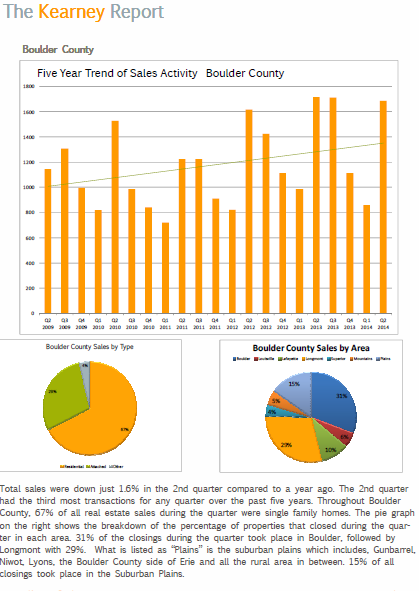
As I analyzed the sales results for the second quarter, the numbers didn’t seem to reflect the market. The number of sales was down slightly (2.7%) but that is like hearing a World War I report that casualties were down slightly and pretending to understand what is going on. More relevant to the understanding of the local real estate market are “Days to Offer”, “Sales to List Price Ratio” and “Median Sales Price”. I will go through each in order.
Days to Offer
When someone says that “the real estate market is good”, I think they are referring to the perception of how long it’s taking for their neighbors houses to sell. The technical term is “Days to Offer” as opposed to “Days on Market” which includes the time the house took to go from contract to closing. Days to offer begins when the property goes on the MLS and continues until it is marked as under contract or pending. When I get the question asking how long it’s going to take to sell their home, this is what they mean. During the second quarter, the average Days to Offer of all properties in Boulder County was 31. Of course there were many homes that sold almost immediately (in practice, even if an offer is received on the first day the DTO will be 3 or 4 because it takes a bit of time to negotiate and get the paperwork done) but an average of one month is truly fast. Last year was a similar market and the DTO was 42. In 2012, it was 74, 2011 it was 89 and in 2010 it was 77. This year the inventory was low and with housing flying quickly off the market the problem was exasperated.
Sales to List Price Ratio
A seller can put any price they want on their home. You see it all over Zillow with their “Make me Move” feature. Joe Homeowner in a fit of especially clear thinking one night at 3 am signs up for the service by listing his home which is worth $250,000 for $499,000. What the heck, maybe someone from China will come in and pay cash. He’ll let his wife in on the big plan once the dream comes true. Usually once a home seller meets with a Realtor and actually lists their home on the MLS the hazy reasoning that a buyer might pay $499,000 has lifted and clearer heads and data have prevailed. Still there, it is common for a seller to want to ask that extra 5% to “see what will happen”. In a normal market buyers see the premium price for what it is and wait for the price to come down. In a frenzied market, like the one we had this spring, buyers tend to quickly justify a reasonable price jump and pay at or near the list price. Traditionally, in the Boulder area the ratio between the sales price and the listing price has been around 97%. This means that the average negotiation is around 3%. This year for all sold properties in Boulder County the sales price to list price ratio was 99.01%. This means that the average negotiation was 1%. Included in this figure were all of the homes that sold for over full price. By any measure, this is a sellers market.
Median Sales Price
How much ones home is worth is a big component about how one feels about their overall financial picture.
Houses selling quickly and for near their asking price are strong indicators for the more important measure of Median Sales Price. Over the past two springs, housing prices have increased. How much is localized to each neighborhood/home and coming up with an overall figure is fraught with some pitfalls. So far this year more homes are selling in higher price ranges. Is this a measure that all prices are rising or is it that more “high end” buyers are purchasing homes and thereby bringing up the average. It could be both. FHFA.gov measures same house sales which eliminates this problem. FHFA.gov reported the 1 year appreciation ended March 31st for Boulder County to be 8.1%. I would expect that number to increase for the second quarter.
As you browse through the rest of the attached report you will find a number of market measures displayed for smaller areas within our market. Boulder and Longmont have the most sales in the area but the real estate markets in those areas are very different. Enjoy the report!
by Neil Kearney | Jul 10, 2014 | Boulder County Housing Trends, Statistics
It’s been a crazy busy summer for me. Which is great, but not so great in terms of reporting statistics and market reports. Here are the latest stats from the sales in Boulder County through June. So far this year sales are down 6% from last year but up 3% from 2012. Overall a good year. We are still struggling with overall low inventory but I’m seeing some improvement on this. Multiple offers have been common this spring (the most I’ve participated in was 13) and prices are rising. Check out the slideshow to see all of the statistics.

by Neil Kearney | May 20, 2014 | Boulder County Housing Trends, Statistics
The major theme for the first quarter were low inventory, lower sales and increasing prices. Since the end of March the market has only seen these factors increase. Multiple offer situations are very common. In fact in the past week I have had two buyers miss out on desirable properties. One house in Boulder had 13 offers on it. My buyers put in a bid 15% higher than the asking price and didn’t get it! The other was a house in Lafayette that had 4 offers on it. They offered 3% higher than the list price and came in second place. It’s a bit crazy out there right now.
Enjoy the report. Kearney Report 1st quarter 2014.
by Neil Kearney | Apr 8, 2014 | Boulder County Housing Trends, Statistics
The first quarter is in the books and this quarter there were 14% fewer sales than a year ago. Inventory lagged all quarter. Prices seem to be rising again mostly due to the lower inventory and the still good demand in most areas.
Please scroll through the slideshow above to get more details on the market. Here are the main take-aways this month.
- Sales in March were 16.6% lower than the same month last year.
- Inventory continues to be very low however we have seen some recent improvement in this measure. Maybe all of the sellers were waiting for spring.
- Multiple offers are very common on new listings.
- The spring buyers are starting to think about real estate and for most there is not much on the market to see. Very difficult of out-of-town buyers.

by Neil Kearney | Mar 21, 2014 | Statistics, Uncategorized
Sales in February were down 8% compared to a year ago and YTD sales are down 12%. The most alarming number and the one that will hold back gains this spring is the low inventory. Available homes for sale is down 20% from a year ago and down over 50% from the same time five years ago. This means fewer signs out in the neighborhoods. This leads to great competition between buyers when new listings come on the market. I will continue to monitor this situation as it unfolds but this I see as the biggest statistical theme of year in the Boulder real estate landscape.