by Neil Kearney | Jan 20, 2015 | Boulder County Housing Trends, For Buyers, For Sellers, Statistics
The Kearney Report – Year in Review 2014
I have just finished compiling the year end market data and have just published “The Kearney Report – 2014 Year In Review”. If you are interested in learning about the real estate market over the past year and how it relates to overall trends over the past fifteen years, I would encourage you to view and download the report. To view the report scroll down and read it on this page. If you would like to view it as a PDF for easy printing click here. I take the time to produce the report so that my clients and you (whomever is reading this) can better understand the market. From good information comes good decisions!
2014 Boulder County Real Estate Market Summary
2014 started out very strong and continued in a healthy manner throughout the year. It was definitely a sellers market. Throughout the spring, the combination of low inventory and high demand made it difficult and frustrating to be a buyer. Multiple offers were very common and in many situations, full price wasn’t enough to win the negotiation. Throughout the spring, home values increased.
By mid June, the pressure of the market had eased a bit. All of the fundamentals in the market were still in place but just less intense. More houses were coming on the market and that supply brought the market back closer to equilibrium. The fall continued in a similar fashion with even fewer houses coming on the market. In 2014, it took on average 38 days to find a buyer and accept an offer. This is a full week quicker than 2013 and a full 49 days quicker than 2010. Low inventory and good buyer demand were the trends for 2014.
The Causes and Effects of Price Appreciation in Boulder County
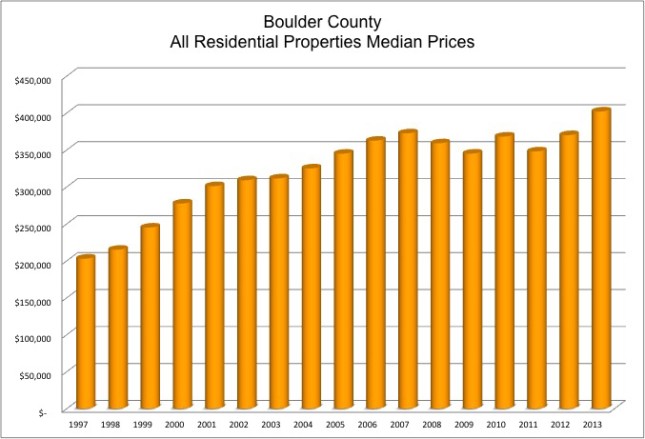
Using a simple measure, median prices of homes and condos in Boulder County increased by 5.5% this year. Last year they were up 6% using the same math. FHFA the national agency which tracks home sales for the Federal Government reported that the home values in Boulder County increased in value by 8.35% for the one year period ending on September 30th (see this represented graphically on page 4 of this report). Homes have appreciated over the past three years, which has erased the affects of the economic downturn. What I’d like to touch on are the causes of the appreciation locally and the effects of the appreciation we are seeing in the market.
Boulder County didn’t go through the boom and bust cycle between 2006 and 2011 that much of the country experienced, so our recent appreciation can’t be explained by saying it is a bounce. A return to historical value. Home prices are now 17% above where they were 5 years ago. Over the past three years I point to three major factors that contributed to our appreciation; low supply of homes on the market, strong buyer demand caused by a strong local economy, low interest rates.
The supply of homes on the market comes from two main sources, resales and new construction (note we don’t have, nor have we had a large supply of foreclosure homes, this has been another source in other areas). Both sources of supply have been constricted since 2008. Existing homeowners have increasingly been sitting out of the market. Many feel that while it would be easy to sell their home it would be difficult to find an acceptable replacement. If you have enough people thinking along these lines it becomes a self-fulfilling prophecy. The economic downturn was difficult on home builders and their banks forced them to sell existing supply and to stop building spec homes. The supply of new homes was a trickle in 2009 and 2010. Builders are now up and running but they can’t keep up with buyer demand. They are also constricted by a lack of tradesman due to so much commercial construction.
The US Census Bureau estimates that Boulder County grew by 5.3% between 2010 and 2013. This means that 15,000 new people moved to our county. Given that there are on average 2.42 people in a household in Boulder County this means that there are over 6,000 new households in Boulder County over the past four years alone. People are moving here because of our robust economy and available jobs. This equation has led to the construction of many new apartment buildings, rising rents and a very tight real estate market with low inventory and rising prices.
The last factor causing appreciation is low interest rates. Affordability has two multipliers; price and cost of money. If one stays low while the other rises, affordability stays reasonable. If both rise, demand falls. For the past six years interest rates have been very low so as prices have risen the out of pocket expense is still reasonable. From the buyer’s perspective, if they need to be aggressive on price in order to get a home, they can do it because they can still easily afford the payment. Sellers have been able to ask more for their homes and buyers have had the ability to afford the payment and the will to beat out their competition.
As you browse through the rest of the report you will find, for comparison purposes, a number of market measures displayed for each of the submarkets in our area. Enjoy the report.

by Neil Kearney | Jan 18, 2015 | Boulder County Housing Trends, Statistics
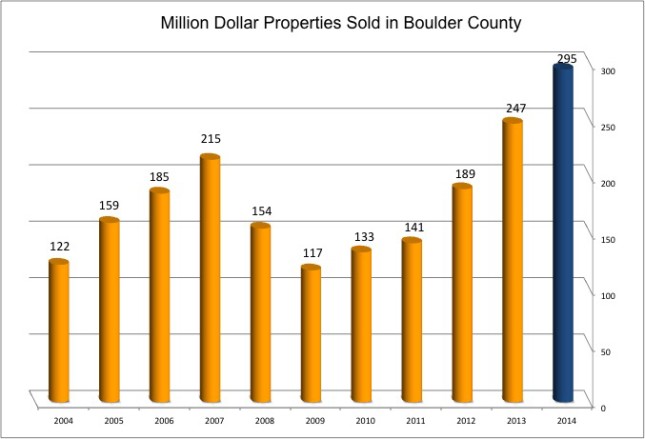
The luxury home market in Boulder County was very strong this past year. I define the luxury market to be homes selling above $1 million. Throughout Boulder County and across all categories there were 295 sales. This represents a 19% increase from last year and a new record. The first chart below shows the number of $million plus sales over time.
The second chart breaks the luxury category into smaller segments. Studying this chart one can see that more than half of the sales in the luxury market are between $1 and $1.5 million. Substantial sales growth was seen below $2 million this year and there was a small gain for sales above $3 million.
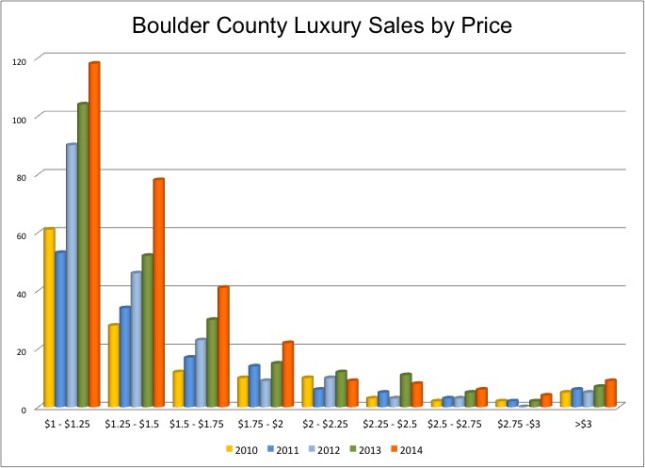
The luxury market segment has recovered well from the economic crash in 2008. Luxury homes are more and more seen as diversification in the portfolios of the wealthy. Over the past decade the housing stock in Boulder County has improved significantly. More and more homes in the luxury segment are built and remodeled each year. Boulder County is becoming known as a relevant destination for high net worth families looking for a lifestyle change. I predict that this trend will continue.
Below are the current luxury homes for sale in Boulder Colorado.
[optima_express_search_results cityId=1049 propertyType=SFR,CND bed= bath= minPrice=1000000 maxPrice= sortBy=pa header=false includeMap=true]
by Neil Kearney | Jan 15, 2015 | Boulder County Housing Trends, For Buyers, Statistics
When a home buyer comes to view property in the Boulder area they soon find out that there are trade offs to consider and compromises to make. This isn’t uncommon, buyers in all areas need to prioritize the location, size, and condition of a home.
Here is a typical progression of a Buyer who is moving to Boulder from an area where the cost of housing is less expensive and they are looking in the $300,000 – $600,000 price range.
- Assumption that they will be able to get a relatively similar home to what they have now.
- After a quick search of online home sites they soon realize that they will need to either settle for a house with a smaller lot, fewer bedrooms or that needs some work.
- They view homes in the City of Boulder and are disappointed. They either raise their target price range or start looking in the surrounding communities.
- They look at homes in Louisville, Superior, Lafayette, Erie or Longmont. Find that they can get more house for the money.
- They then are forced to re-visit and clarify their priorities.
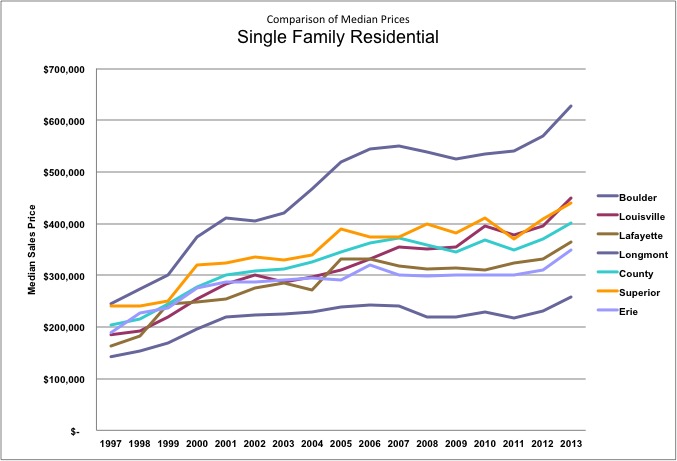
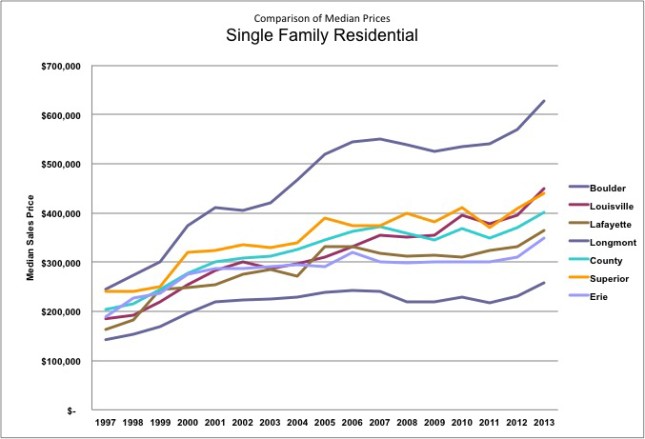
The graphs below show a comparison of median prices across the various communities of Boulder County starting in 1997. Back then, prices throughout the county had a much smaller disparity. The median price for a home in Boulder was just 20% above the county average. In the ensuing years, the gap has increased considerably. Now the median price of a home in Boulder is nearly $700,000 while the county median is just over $400,000.
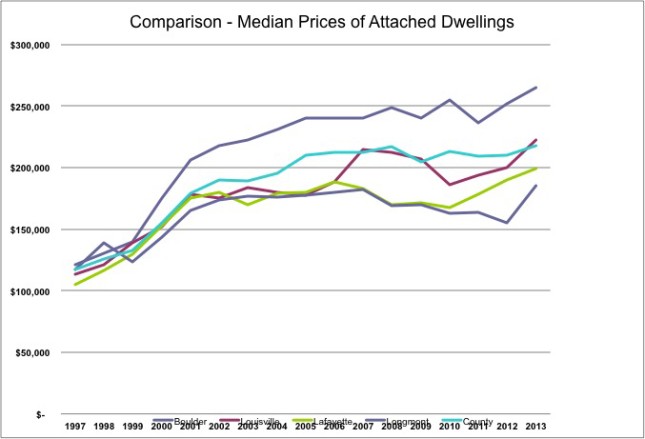
The lower graph shows the prices for attached dwellings in Boulder, Louisville, Lafayette, Longmont and Boulder County. There isn’t as much difference in condos as there is in single family homes. One reason for this is that the condos in Boulder tend to be smaller than those further east.

by Neil Kearney | Jan 13, 2015 | Boulder County Housing Trends, Statistics
The calendar has made the switch and now is the time that I’m crunching numbers and getting ready to release my year end reports. One figure that everyone is always interested in, is the change in home prices. For the third straight year we have seen positive home value appreciation in Boulder County. The median price for a single family home in Boulder County increased by 8.6% over last year. Condos and townhomes increased by a more modest 3.8%.
These figures just compute the midpoint of all relevant sales so it is only an indicator of the market not an actual statistic for any individual property.
FHFA.gov is the government agency that oversees the housing and mortgage markets. They track home values and produce a report on a quarterly basis. Their ongoing study tracks same house sales. This means that they only count houses that they can track over time. This gives a more accurate number than just taking the median. The results for the fourth quarter are not published yet so the information below is based on their statistics through the third quarter.
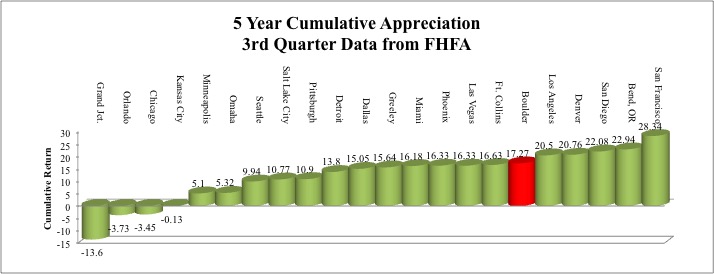
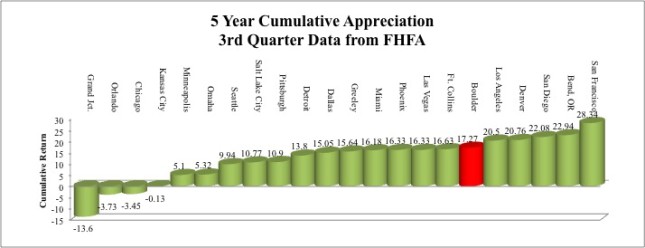
The first graph below uses FHFA.gov data and shows how prices in Boulder County compare to 21 other areas around the country over the past five years. Boulder is indicated in red. Over the past five years the average home price in Boulder County has appreciated by 17.27%. The returns are ranked from lowest to highest from left to right. Homes in San Francisco have appreciated by 28% during the last five years.
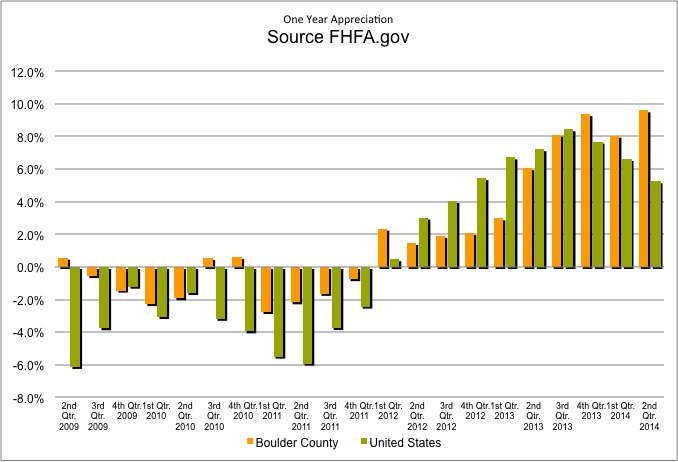
The next graph shows the last five years of price appreciation in Boulder County and the US average reported on a quarterly basis. FHFA.gov reports that Boulder County has seen 8.35% appreciation for the one year period ending on September 30th. Our market went down quite a bit less when values dropped and has gone up more than the national average. This is the sign of a good investment.


by Neil Kearney | Jan 7, 2015 | Boulder County Housing Trends, Statistics
December was a strong month in the local real estate market. Sales in Boulder County were up 8.8% compared to last December. This strong result helped bring the year end sales total to just 3% behind 2013. Inventory of homes on the market continues to be a concern. At the end of December there were just 579 properties on the market in Boulder County that were not already pending. This is the lowest figure since I have been tracking it. Hopefully there are many sellers getting their homes ready to sell this spring. The demand is there and sellers have seen good appreciation over the past three years. The slideshow below gives a detailed view of what has happened in the Boulder area real estate market over the past four years.

by Neil Kearney | Dec 21, 2014 | Boulder County Housing Trends, Statistics
Residential real estate sales in November were up 5% from a year ago but down 18% from October. The drop off in closings is normal this time of year. Year-to-date, sales are down 4% from last year and up 5% from 2012. The inventory of homes on the market continues to be very low. The slideshow below gives detailed information about the sales activity, under contract percentage and inventory levels. It also shows activity levels by month and week over the past four years.