by Neil Kearney | Jan 30, 2012 | Boulder County Housing Trends, Statistics
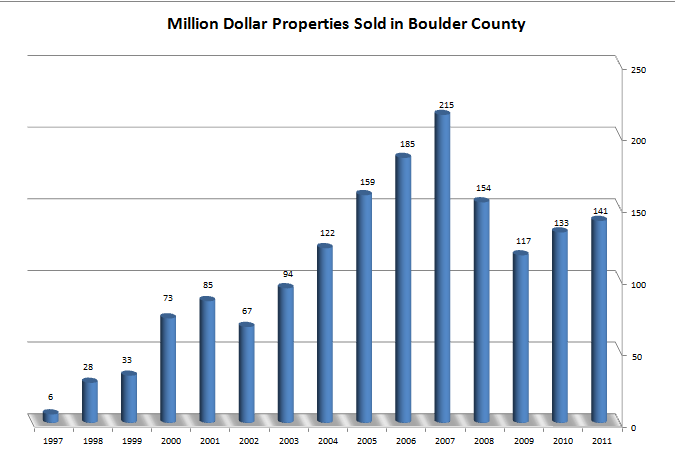
I define the luxury market in Boulder County to be homes over $1 million. Luxury homes make up approximately 3.5% of the total market in Boulder County (based on 2011 sales).
The number of sales of all homes in Boulder County was down 2.6% during 2011 while the sales of properties over $1,000,000 was up 6%. This is an unexpected statistic for many because the assumption is when sales are down luxury sales will reflect a compounded decline. This post will give you the information you need to interpret the luxury home segment in Boulder County.
Sales Trends:

As you can see from the graph, million dollar sales in the Boulder area have not always been a big part of the market. During the 2000’s we saw many new luxury properties built and many existing homes remodeled into the luxury category. During this time frame we also had a new category of luxury property take hold in Boulder; downtown luxury condominiums.
Price Range Mix:

The graph above shows the luxury home market split up into smaller segments. Sales for 2010 and 2011 are recorded for each $250,000 segment. You can see that the majority of the sales in the Boulder County luxury home market take place below $1.5 million.
Negotiation:
The average negotiation off of list price for all homes that closed in 2011 was 4.1%. So for example if you had your home listed for $400,000 you could reasonably expect your home to sell for $383,600. These past few years showed an interesting trend; as the price range increased the average negotiation increased as well. For homes that sold for over $1 million the average negotiation off of the last list price was 7.67%. For the 24 homes that sold above $2 million last year, the average negotiation was 11.11%.
If you are interested in selling or purchasing a fine home in Boulder County I think you will find that my experience, knowledge and marketing methods are well suited in serving you.

by Neil Kearney | Jan 16, 2012 | Boulder County Housing Trends, Statistics
I just finished my annual analysis of the real estate market in Boulder County. In addition to the overall sales trends, I look at the real estate market in Boulder, Louisville, Lafayette, Longmont, Erie, Superior, Suburban Plains and Suburban Mountains. The annotated slide show gives all of the detail for each of these areas.
Here are a few of the important points:
- Total Sales across all categories in Boulder County fell by 2.6%.
- Median Price across all categories in Boulder County fell 1.5%.
- Sales in the City of Boulder were up slightly from last year.
- Sales in Louisville were up 16% from last year.
- Sales in Erie were up 23% over last year!
- Longmont bounced back with 9% more sales in 2011 than in 2010.
- FOR MUCH OF BOULDER COUNTY 2011 WAS A RECOVERY YEAR.
What does 2012 have in store? Here are a few of my ideas:
- One of the challenges right now is to build the inventory of active listings. Buyers are wishing there was more to choose from.
- Factors that point toward an improving market:
- The local economy is improving.
- Interest rates will continue to be favorable.
- Lending guidelines are expected to loosen in the coming year.
- Nationally, foreclosures need to move through the market in order to see overall improvement. Locally, foreclosures have not been a huge issue. This will help us to recover even more quickly.

by Neil Kearney | Jan 9, 2012 | Boulder County Housing Trends, Statistics
The year ended more slowly than I thought it would. December sales for all types of real estate were down 9% for the month. This pulled the year end total 4% behind 2010.
Sales of single family homes were down 13% for the month. Looking back, the only other December in recent history that had sales under 200 units was 2008. As I recall the later months of 2008 the optimism was not high. However, I am excited for the possibilities of 2012. I expect to have a great year selling real estate. Interest rates continue to be favorable and the overall economy is gaining traction. Locally, business seem to be doing well and people keep moving to town. If you are considering a move to the Boulder area I would love to show you why buying real estate in this area is a great investment.
Here are the charts showing the monthly sales activity for Boulder County. Also, included are weekly trends of homes going under contract, total inventory trends and percentage of homes under contract on a monthly basis. For all of your real estate needs call me, I’d love to help.

by Neil Kearney | Dec 6, 2011 | Boulder County Housing Trends, Statistics
Over the past five years homes in Boulder County have appreciated 1.2%. This may not seem impressive but we are in the quarter of all metropolitan areas in the United States for real estate appreciation over the past five years. There are only 70 other communities that beat the Boulder area in terms of home price appreciation over the past five years! The average home in the United States has lost 18.5% over the same time frame. Homes in Las Vegas have lost 60% of their value over the past five years. In comparison 1.2% seems really good! Here is a picture from FHFA.gov which shows five year home appreciation for all 50 states.
 FHFA.gov released its third quarter report recently and in addition to the information above, here are some interesting facts:
- Appreciation in Boulder County for the 1 year period ending September 30, 2011 was -1.6% (again ranked 71st in the nation).
- Appreciation during the third quarter in Boulder was 1.13%. We had a good summer supporting stronger prices.
- Homes in the United States on average lost 3.74% in value.
- The top area for appreciation was Bismarck, North Dakota with 5.52%. Call this the “fracking effect”.
- The area that saw the biggest loss over the past year was Las Vegas (again) with -15.16%.

by Neil Kearney | Dec 1, 2011 | Boulder County Housing Trends, For Buyers, Statistics
Yesterday, I shared with you how different price ranges are currently selling in the Boulder County home market. Today we are going  to look at the same indicators but today, we will use the data to find out which town has the strongest real estate market.
Under Contract Percentage:
This is simply the number of homes currently under contract divided by the number of homes on the market. The higher the number the stronger the market. The areas that have the highest percentage of homes under contract (Louisville and Superior) also happen to have the fewest homes on the market. Few homes on the market, steady demand = strong market.
- Boulder 14%
- Louisville 24%
- Lafayette 22%
- Longmont 20%
- Superior 25%
- Mountains 14%
- Plains 13%
Absorption Rate:
Absorption rate compares the number of homes that sell during an average month (I use 12 months) to the number of homes currently on the market. For example if on average 10 homes sell per month and there are 120 homes on the market, the absorption rate would be 12 months. Another way of saying it would be, that it would take 1 year to sell all of the current inventory. A low number shows quick turnover and a strong market. During the late fall and winter when many would-be sellers remove their homes from the market the absorption rates are unusually low. Again, Superior and Louisville show the healthiest market and the mountains show the weakest market.
- Boulder 6.9 months
- Louisville 4.3 months
- Lafayette 5.9 months
- Longmont 6.1 months
- Superior 4.2 months
- Mountains 12.4 months
- Plains 9.2 months
Average Negotiation Off Of List Price:
The areas that showed the strongest indicators in the statistics above also had the smallest average negotiation off of the list price.
- Boulder 4.74%
- Louisville 2.63%
- Lafayette 2.65%
- Longmont 2.95%
- Superior 2.84%
- Mountains 6.28%
- Plains 4.78%
Overall Ranking of Strength of Market:
When you average out these results and rank for total strength, here are the strongest real estate markets in Boulder County right now.
1. Louisville and Superior (tie)
2. Lafayette
3. Longmont
4. Boulder
5. Suburban Mountains and Suburban Plains (tie)
Of course more goes into it than just these three statistics. So when you are ready to buy or sell real estate in Boulder County call a professional real estate agent like me. Neil Kearney 303.818.4055
by Neil Kearney | Nov 30, 2011 | Boulder County Housing Trends, For Buyers, For Sellers, Statistics
Right now the broad trends in the Boulder area real estate market are:
- Sales at a consistent although not spectacular rate. (Down roughly 5% from last year)
- Inventory decreasing (normal for this time of year)
- Prices are fairly stable but with a nudge toward the negative.
- Buyers market with the average negotiation in Boulder County over the last 12 months at 4.17% off of last list price.
Today, I am going to break the market down into smaller silo’s so that you can get a better idea of the market across the different price ranges. Tomorrow, I will do the same thing but instead of using prices I will use areas. Here it goes.
Under Contract Percentage:
This is simply the number of homes currently under contract divided by the number of homes on the market. The higher the number the stronger the market. Not surprisingly, the lower price ranges have quite a bit more activity than the higher price ranges. Usually, there is more stratification between the $750,000 range and the homes listed above $1,500,000 but right now that is not the case. There are currently 18 homes under contract that are listed above $1,000,000 in Boulder County.
- $0 – $250k 20%
- $250k – $500k 20%
- $500k – $750k 14%
- $750k – $1MM 7%
- $1MM – 1.5MM 7%
- >$1.5MM 7%
Absorption Rate:
Absorption rate compares the number of homes that sell during an average month (I use 12 months) to the number of homes currently on the market. For example if on average 10 homes sell per month and there are 120 homes on the market, the absorption rate would be 12 months. Another way of saying it would be, that it would take 1 year to sell all of the current inventory. A low number shows quick turnover and a strong market. During the late fall and winter when many would-be sellers remove their homes from the market the absorption rates are unusually low. Even so, by this measure in would take 31 months to clear all of the homes on the market in Boulder County that are listed above $1.5 million.
- $0 – $250k 5.3 months
- $250k – $500k 6.2 months
- $500k – $750k 8.6 months
- $750k – $1MM 13.6 months
- $1MM – 1.5MM 15.4 months
- >$1.5MM 31 months
Average Negotiation Off Of List Price:
It is very interesting to see how much negotiation is going on between buyers and sellers. A good rule of thumb over all of the years I have been selling homes in the Boulder area has been 3% off of list price. For the last year, the average has jumped to 4.17% over all price ranges and areas in Boulder County. From the figures below you can see that properties under $500,000 are still in the historical 3% range. Where we are seeing more negotiation is in the upper price ranges. You can relate the motivation of the seller to the previous table (absorption rate) and see that many sellers are valuing the opportunity to sell and are willing to stray off of their list price to get it done.
- $0 – $250k 3.13%
- $250k – $500k 3.08%
- $500k – $750k 3.87%
- $750k – $1MM 5.21%
- $1MM – 1.5MM 5.91%
- >$1.5MM 9.72%

