by Neil Kearney | Apr 17, 2015 | Boulder County Housing Trends, Statistics
I’ve just published The Kearney Report for the First Quarter 2015. To download and view the entire report in PDF click here  The Kearney Report 1st quarter 2015
Real Estate Market Update
The broad trends we have been seeing in the market over the past three years have accelerated. Declining inventory and increasing prices, are now making it very difficult for buyers and move-up sellers. The trends that make it so great to be a seller have not only continued in 2015 thus far, they have accelerated.
At the end of March in 2010 there were 1,724 single family homes on the market that didn’t already have an offer on them. At the same time in 2013 there were 818 homes available. This year there were just 413 homes in all of Boulder County on which a buyer could make an offer. If a home is properly priced and marketed, it is very typical for it to go under contract within a very short time frame.
Multiple offers have been very common. Of the 884 sales in the quarter, 32% sold for greater than full price and 19% sold for exactly asking price. The average premium paid for those homes that did sell above the list price was 3.6%. The largest premium paid was 19% over the list price. On average, homes in Boulder County appreciated around 8% last year. This year we seem to be on a similar track. In some areas we are seeing year-over-year gains of around 20%!
Buyers, who are still enjoying low interest rates, are rushing to get something purchased before the rates rise (it seems like we have been waiting for quite some time). This pressure, added to the fact that there are not many houses to see make it easy to get caught up in the competition of multiple offers. Buyers are worried about being priced out of the market as prices and interest rates rise.
Even though we have seen a 9% drop in the number of new listings, total sales for the quarter increased by 24%. Just like a person climbing Mt. Everest dips into their fat reserves in order to keep expending energy, our housing market has sold up the existing inventory in order to sustain sales. The good news is that we have a strong and desirable real estate market, the bad news is that there have not been enough sellers to meet demand.
Some possible reasons that homeowners are not becoming sellers:
- The Catch-22 scenario – A potential seller refuses to list their home for sale until there are other homes on the market that they are interested in buying. But of course others don’t come on the market because they too are waiting for a few reasonable options to stay on the market long enough. It’s an intellectual spiral.
- Baby boomers are staying in their homes longer than in the past. Possible reasons: a) Overall better health. b) Their homes have appreciated and they are bumping up against the capital gains limits.
- Homeowners have locked in low rates/payments. While we haven’t yet seen a big gain in interest rates, many homeowners are tickled with their current situation and are happy improving their home rather than moving to a new one. This is especially true for those who purchased between 2008 and 2011 before home appreciation ramped up again.
Here is our advice for buyers and sellers in the current market.
Buyers – It takes alertness, patience and persistence to find a home right now. Competition is fierce and you must be ready to see new listings within the first few days on the market. We, as your Realtor can help you keep abreast of the market by sending you instant updates when listings hit the MLS and then quickly analyze the value of each house as you consider a competitive offer. In addition to making offers above full price, many buyers have waived contingencies to make their offers attractive to sellers.
Sellers – It’s a great time to be a seller! A property that is competitively priced, shows well and is marketed professionally often receives very strong offers and in many cases multiple offers. As listing agents, we have been helping our clients set pricing strategies, set advantageous listing and marketing schedules and hopefully sort through the merits of multiple offers. The difficulties for sellers are in selling one home and buying another. This can be more easily done by getting a temporary rental or arranging bridge financing to allow for a purchase before the sale.
As you browse through the rest of the report you will find, for comparison purposes, a number of market measures displayed for each of the submarkets in our area. Enjoy the report.

by Neil Kearney | Apr 7, 2015 | Boulder County Housing Trends, Statistics
The real estate market in Boulder County continues to be red hot. Despite a serious decrease in the number of homes on the market sales soared during the first quarter. Compared to a year ago sales of single family homes and residential condos and townhomes were up 38.5% during the month of March and up 24% for the first quarter.
Inventory of homes for sale rose a bit but is still well below the average for this time of year. The total number of active listings on the MLS in Boulder County at the end of March was down 27% from a year ago. More to the point, the number of available listings (not under contract) was down 56% from a year ago. At the end of March there were just 498 homes that were available to purchase. A statistic that shows this relationship is the under contract %. At the end of March nearly 60% of the listed homes were already under contract waiting to close.
Check out the slideshow to see these and other statistics shows graphically.
by Neil Kearney | Mar 13, 2015 | Boulder County Housing Trends, Statistics
The home market in Boulder County is red hot. Buyers are swarming new listings and competing in multiple offer situations across the county. Being a seller of real estate is a great place to be but on the other hand being a buyer is a tough situation. Decisions need to be made quickly, and competition is fierce.
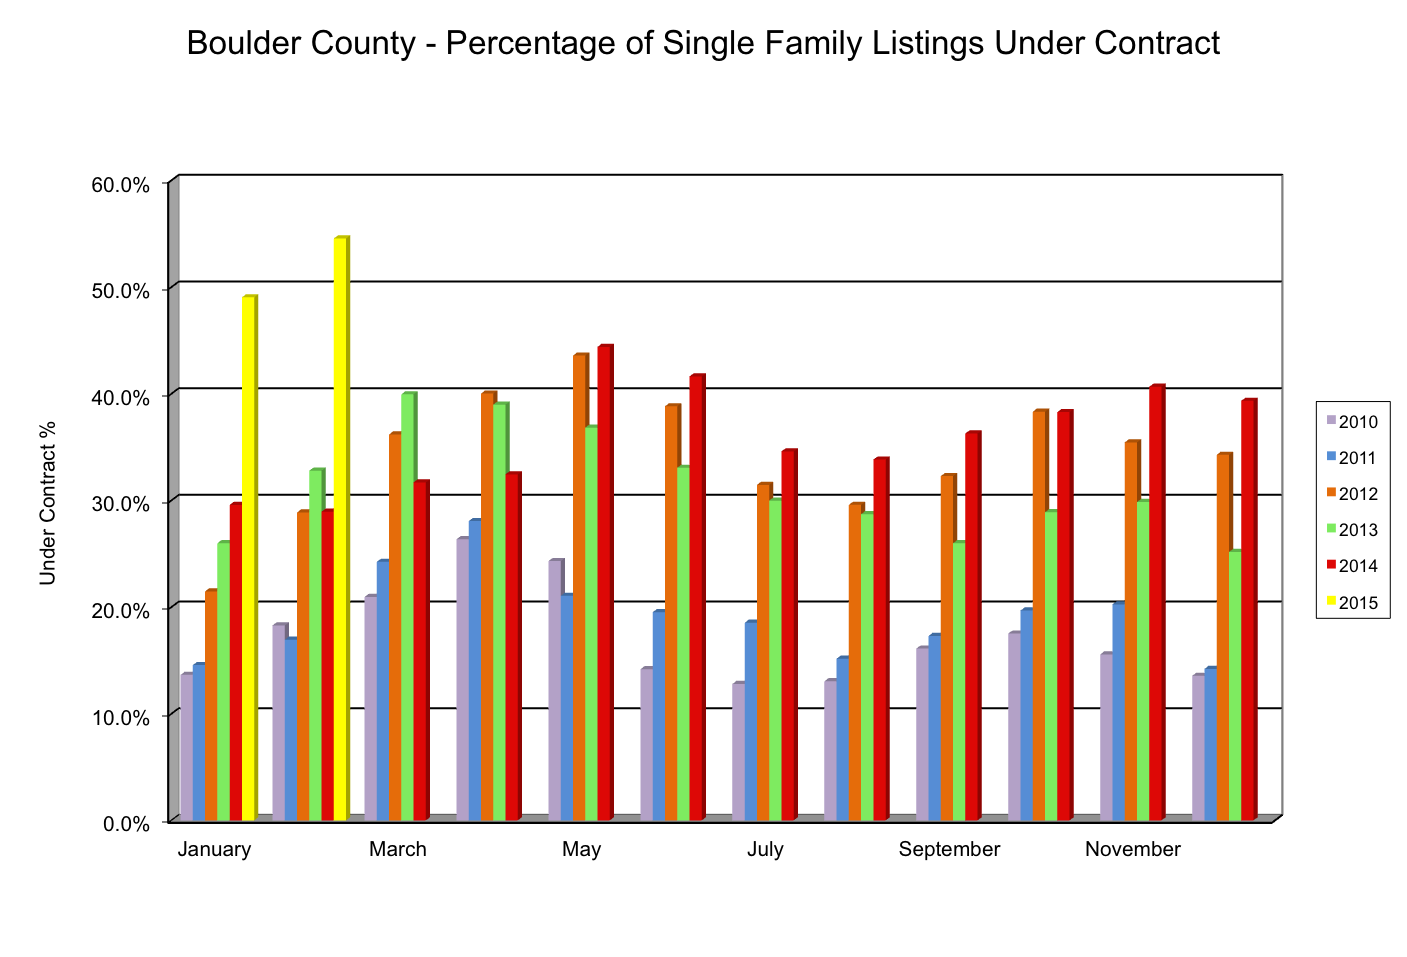
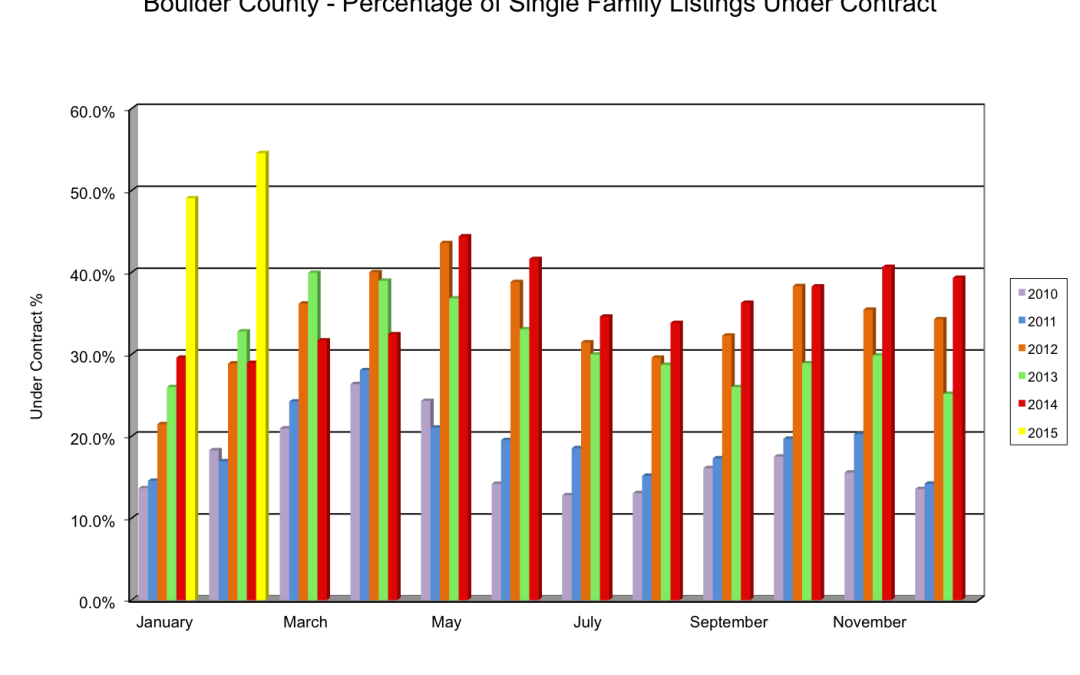
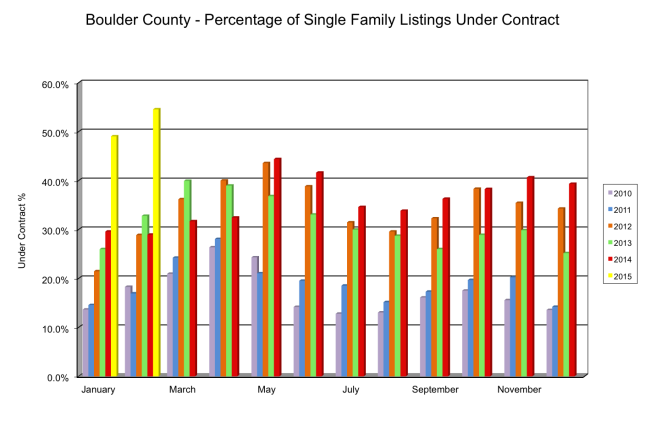
Through February sales of residential homes and condos in Boulder County are up 15% from last year. In February sales were up 21%. However, homes are going on the market at the same pace as last year. This is causing a spike in the percentage of homes that are under contract. Buyers who are out looking are finding that over half of the homes that are showing as active on most websites are already under contract.
Here is a chart showing the under contract percentage by month over the past five years.
View the slideshow below to view all of statistics for the month and the real estate trends over time.
Theses overriding themes persist: low inventory, high buyer demand, rising prices.
by Neil Kearney | Mar 3, 2015 | Boulder County Housing Trends, Statistics
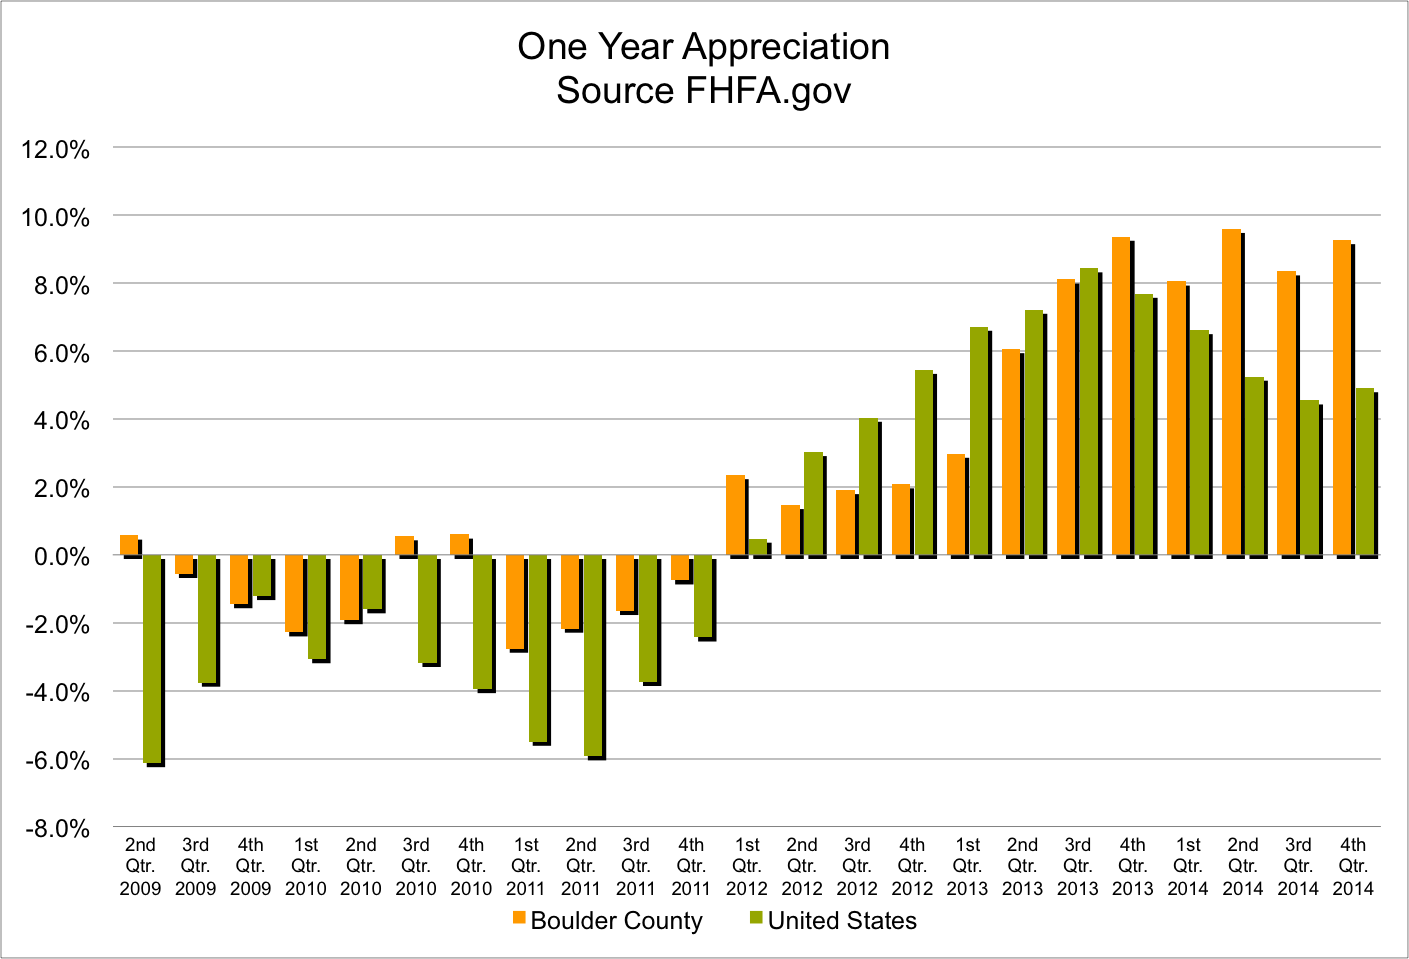
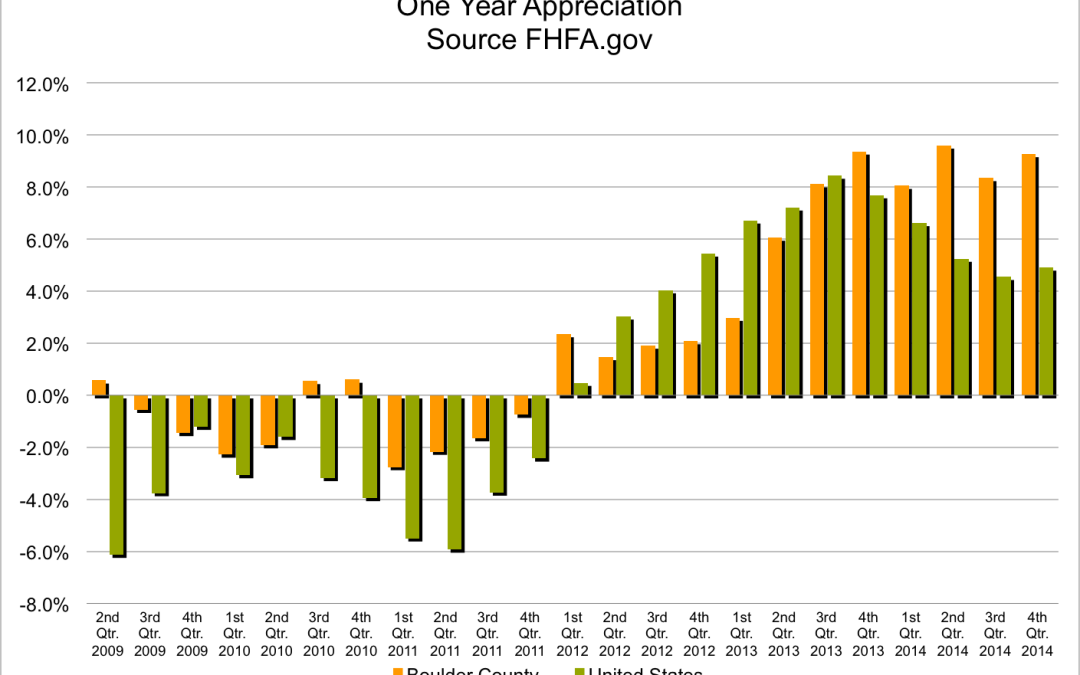
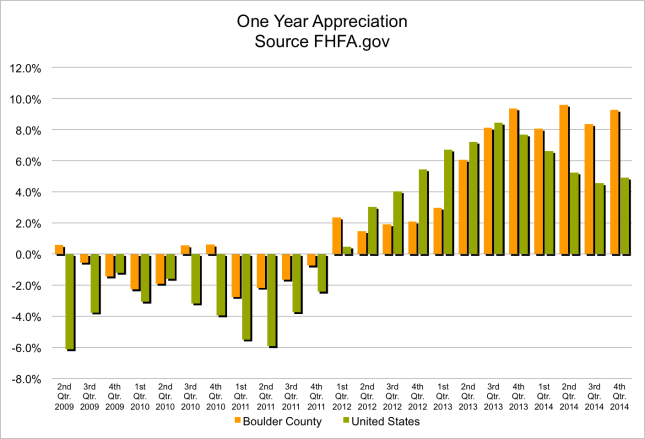
The latest Home Price Index put out by FHFA.gov shows that Boulder County is in the top 12% of areas in the United States for home appreciation. The report shows that homes in Boulder County appreciated 1.67% during the 4th quarter and 9.27% during 2014. This ranks 34th best out of the 275 areas in the survey. The United States as a whole had home appreciation of 4.91% during the year. FHFA is the government agency that is charged with oversight of the housing sector.
The first graph below shows Boulder’s home price appreciation compared to the United States. Each bar shows the home value change for the previous four quarters. During 2009 – 2011 our area had less extreme losses in value. In 2012 the U.S. as a whole bounced back more quickly than we did. In 2013 our returns were similar to the nations average. But in 2014 our market has been much stronger than the United States as a whole. Over the past five years the cumulative appreciation in home prices in Boulder County has been 19.39%. For the United States it was 11.59%.
The chart below shows our national ranking. Currently it’s 34th out of 275. The lower number the better our market is performing compared to the average home in the United States.
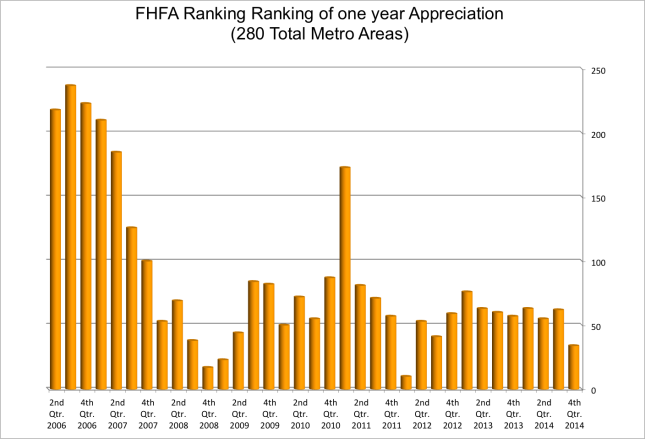
The way things are going so far this year, I would expect that our ranking would stay strong if not improve. We are seeing multiple offers on homes and condos in Boulder right now. Having over 10 offers is not unusual and properties are routinely going for more than 5% over asking price.

by Neil Kearney | Feb 16, 2015 | Boulder County Housing Trends, Statistics
The Boulder County real estate market is off to a very fast start. Buyer demand is very high and multiple offer situations are already very common. It’s not uncommon to have over 10 offers submitted over the first two days on the market for an attractive listing in a lower price range. The number of properties that have gone under contract so far this year is comparable to last year but the supply of homes on the market continues to lag.
Fewer homes are coming on the market so far and as a result the static level of homes on the market has fallen to an all time low. At the end of January just 493 properties were active and available (without a contract pending) in Boulder County. Last year we were at over 900 available properties and we thought that was low. As a result of these two factors the under contract percentage for the market is around 50%. That means that half of all for signs you see are already spoken for. The slideshow below gives a full view of what is going on.
by Neil Kearney | Feb 13, 2015 | Boulder County Housing Trends, Statistics
This past week we saw good improvement in the number of new listings on the market. So far this year the activity in the market can be summarized as, buyers-plenty, sellers – not so much.
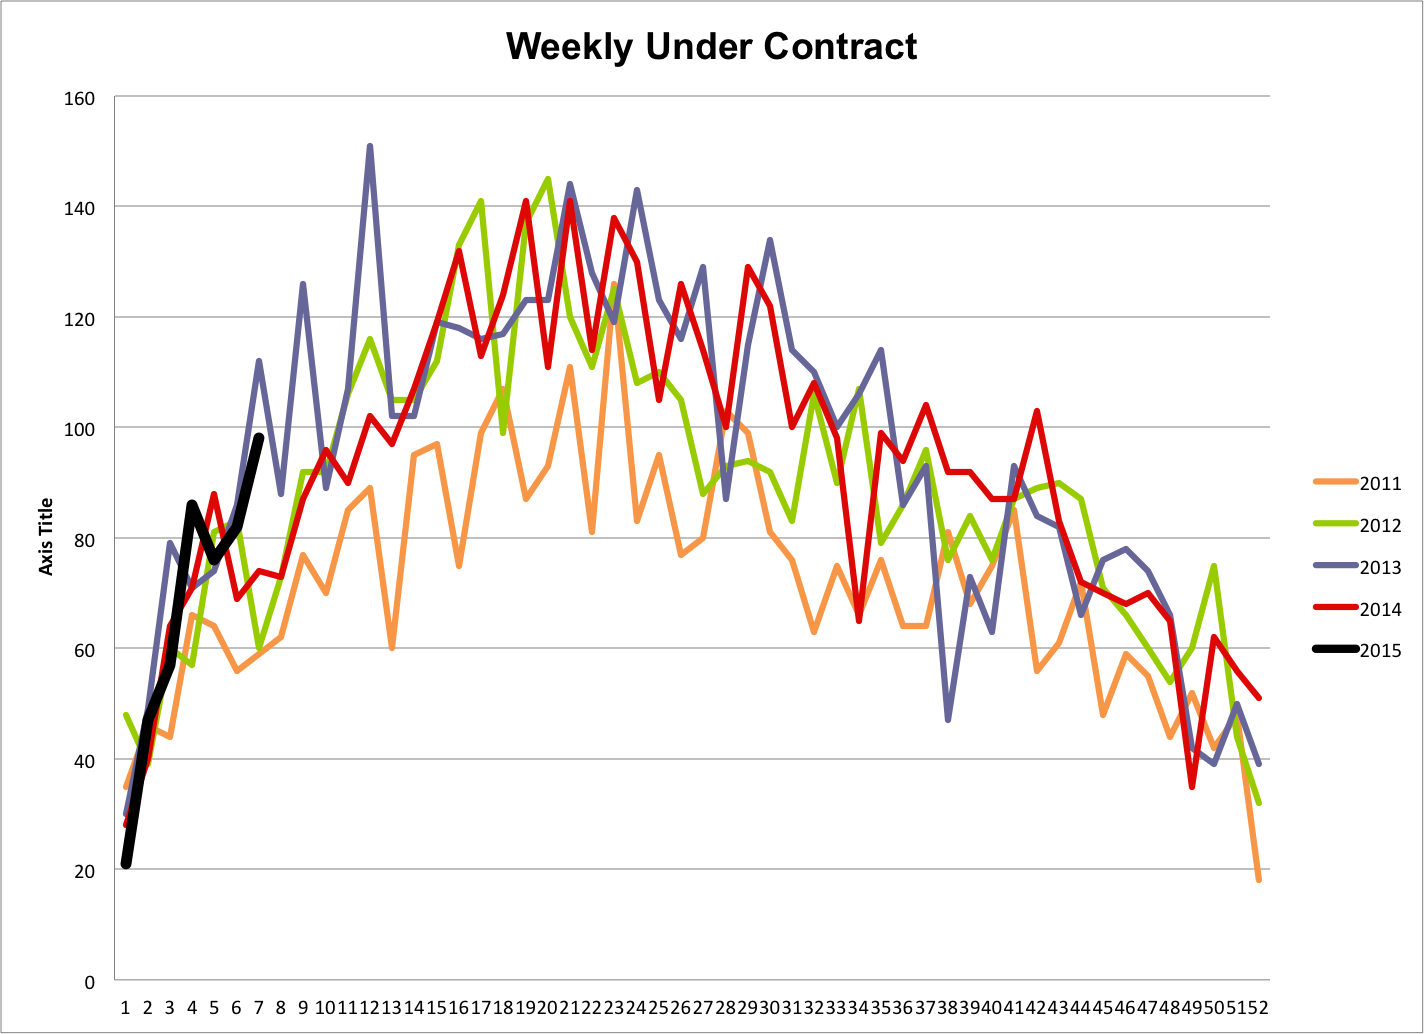
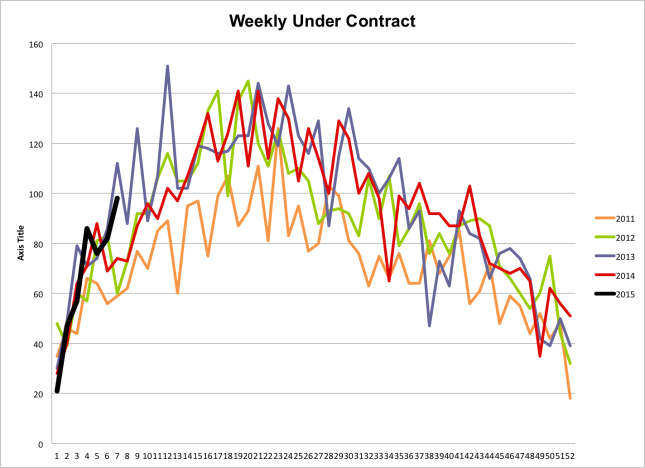
Every Thursday morning over the past five years I search the market and chart how many houses were listed, how many went under contract and how many have sold. The first chart here shows the number of homes that go under contract each week. The dark black line represents this year and as you can see it is in line with past years. In fact the past two weeks have exceeded last year by a good margin. Overall we have very strong demand.
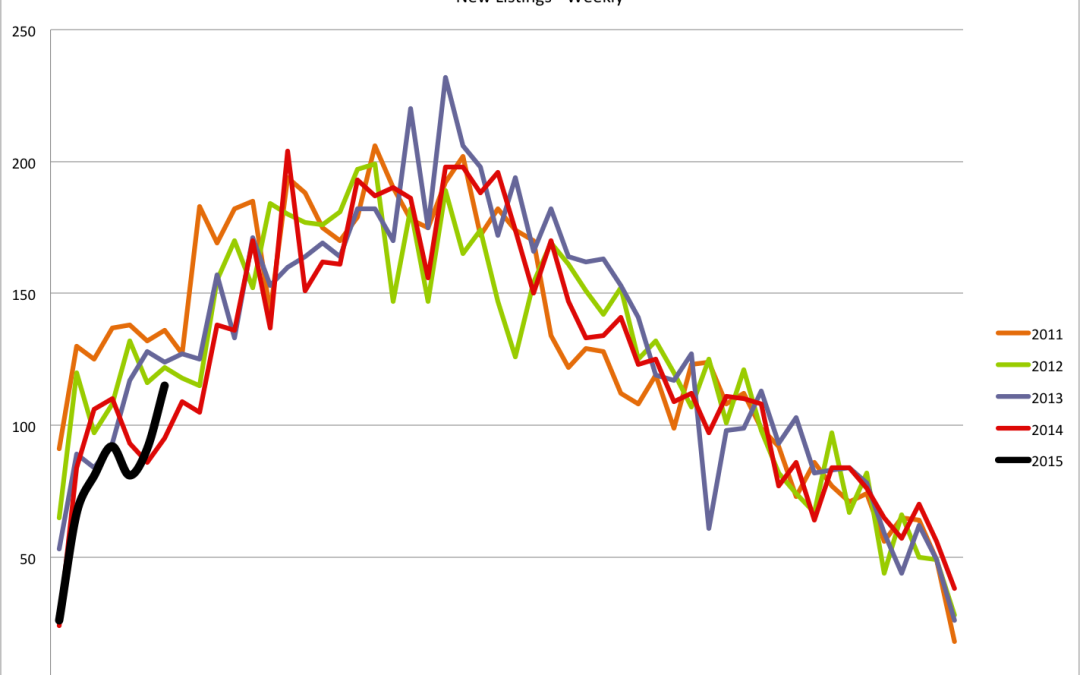
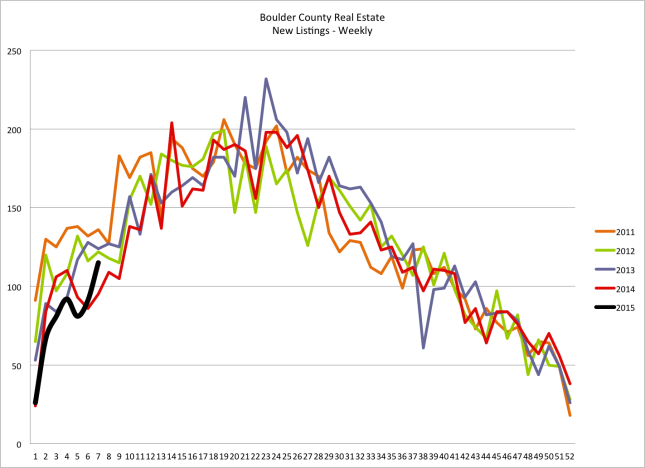
 On the other hand, supply has been lagging. Up until this past week the flow of new listings to the market has been very slow. Taking in concert with the steady demand, it’s easy to see why our inventory is at an all time low. I was showing a buyer homes yesterday in Boulder and there were 8 available listings in Boulder listed between $550,000 and $800,000. The chart below shows the flow of listings to the market on a weekly basis over the last five years. Most of this year the flow of new listings has been below that of recent years. Up until this past week. Maybe this is a sign that things are picking up.

 The Kearney Report 1st quarter 2015