
It was clear that prices were rising this spring. There were tons of homes selling for full price or above and it seemed each sale was breaking new territory. Buyers felt it as “that one” deal got away and never came back around. Sellers felt it as they sold for higher than the had imagined just months earlier. But this is all anecdotal. Hard figures were hard to find and month to month numbers are much too volatile to be trusted. I’ve been tracking the FHFA.gov home price statistics quarterly since 2006 and they give a stable platform from which to compare prices. Not only in our market but across the county. Here are the latest home appreciation results from the second quarter of 2014.
For the one year period ending June 30th homes on average increased in value by 9.6%. This is the highest figure since 2006 and ranked us 55th highest out of the largest 276 metropolitan areas. During the second quarter the appreciation rate in our market was 3.81%. This ranked 33rd highest nationally. Since the 2nd quarter of 2008 homes in our market have appreciated on average 13.7%. This is 21st best in the nation. The chart below shows the rolling one year appreciation of Boulder County compared to the United States as a whole over the past five years.
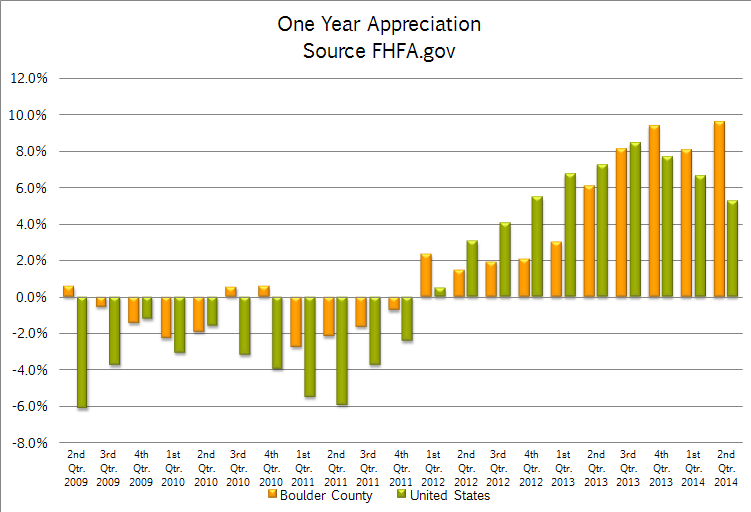
The one year appreciation in the United States as a whole has slowed a bit but at 5.25% is still historically quite strong. However during the second quarter the appreciation was just .81%. Over the last five years the national housing stock has appreciated in value by 8.25%.
The top states for home appreciation right now are; Nevada (14.8%), California (11.38%), District of Columbia (10.74%), North Dakota (8.68%) and Arizona (8.39%). Colorado ranks 8th with 7.76%. The states that rank lowest in home appreciation are Mississippi (-.51%), Connecticut (.29%), Alaska (.34%), Delaware (1.13%), and Virginia (1.24%).
The top Metropolitan Areas for home appreciation are all in California and all showed gains in the 22 – 25% range. These are the same areas that were hit the hardest during the economic and housing crisis but now have recovered and are now positive for the five year period. The areas that have the lowest appreciation (-3.5 to -2%) are located in Ohio, Wisconsin, New Jersey, Illinois, and New Mexico.

