
by Neil Kearney | Dec 8, 2020 | Boulder County Housing Trends, Statistics
Monthly sales were again up significantly compared to the same month last year. YTD sales are now up 7.3% when compared to 2019. The market is seeing a surge in sales activity but not a commensurate increase in listings. As a result, the inventory of available homes is quite low. This disparity between supply (low) and demand (high) is causing a steep rise in prices. Even in early December we are seeing good activity in the Boulder County real estate market. Multiple offer situations on attractive new listings are common as inventory of new listings isn’t keeping up with demand. The number of newly accepted contracts has fallen over the past month, but it seems to be in direct relation to the number of new listings coming on the market. At the end of November over 52% of the active listings on the MLS were pending with an accepted contract. This type of demand bodes well for a strong start to 2021. See all of the details and trends in the slides below.

by Neil Kearney | Nov 10, 2020 | Boulder County Housing Trends, Statistics
As we move towards the holidays and winter the Boulder area real estate market is still very strong. Consistent buyer demand has put sellers in a very good position. Multiple offers on well priced properties are common. We are still seeing a wave of out-of-town buyers in various stages coming to town. I expect that this wave to continue into the spring 2021 season. The pandemic is ramping up again which may make showings more difficult in some instances, but it hasn’t seemed to dampen buyer demand.
Statistical Note: In October 2020 IRES MLS the facilitator of cooperation and the keeper of the data for Northern Colorado began sharing data again with REColorado the MLS for the Denver Metro Area. This data surge resulted in a jump in properties that are included in this report. The jump will even out over time but for now it’s difficult to know exactly how much of an effect this has on the data. Overall, the trends are still significant.

by Neil Kearney | Oct 5, 2020 | Boulder County Housing Trends, Statistics
The local real estate market continues its strong run! Since June buyers have been very active and despite taking a nearly two-month hiatus in March and April, total sales have now exceeded 2019 through the first three quarters. The market can be characterized by low inventory and high demand. The average sale last month closed for 99.62% of the listing price. On average, those listings received an offer after being on the market for 30 days. View the slideshow below for more details including five year trending.

by Neil Kearney | Sep 11, 2020 | Boulder County Housing Trends, Statistics
The local real estate market continues to be very active and strong. More properties are selling than are coming on the market resulting in a loss of inventory. When inventory of available homes is very low it results in shorter days on the market and increased prices. After seeing stagnant prices earlier in the year it appears that prices are on the rise again. Sales in August were up 25% compared to the same month a year ago. With the strong summer year-to-date sales in Boulder County are now down just 1% from a year ago. With the current momentum, I expect that even with a two-month hiatus, sales in 2020 will exceed 2019. See the slideshow below for full details and five year trends.

by Neil Kearney | Aug 20, 2020 | Boulder County Housing Trends, Statistics
Even with so much economic and political uncertainty, our local real estate market is seeing great activity. The stock market and housing market have fully recovered from the initial shock of the pandemic and we are seeing demand (sales) outpace supply (new listings). This results in positive pressure on prices as well as shorter time on the market. Lifestyle areas with a vibrant economy, like Boulder, are attracting people from more crowded parts of the country.
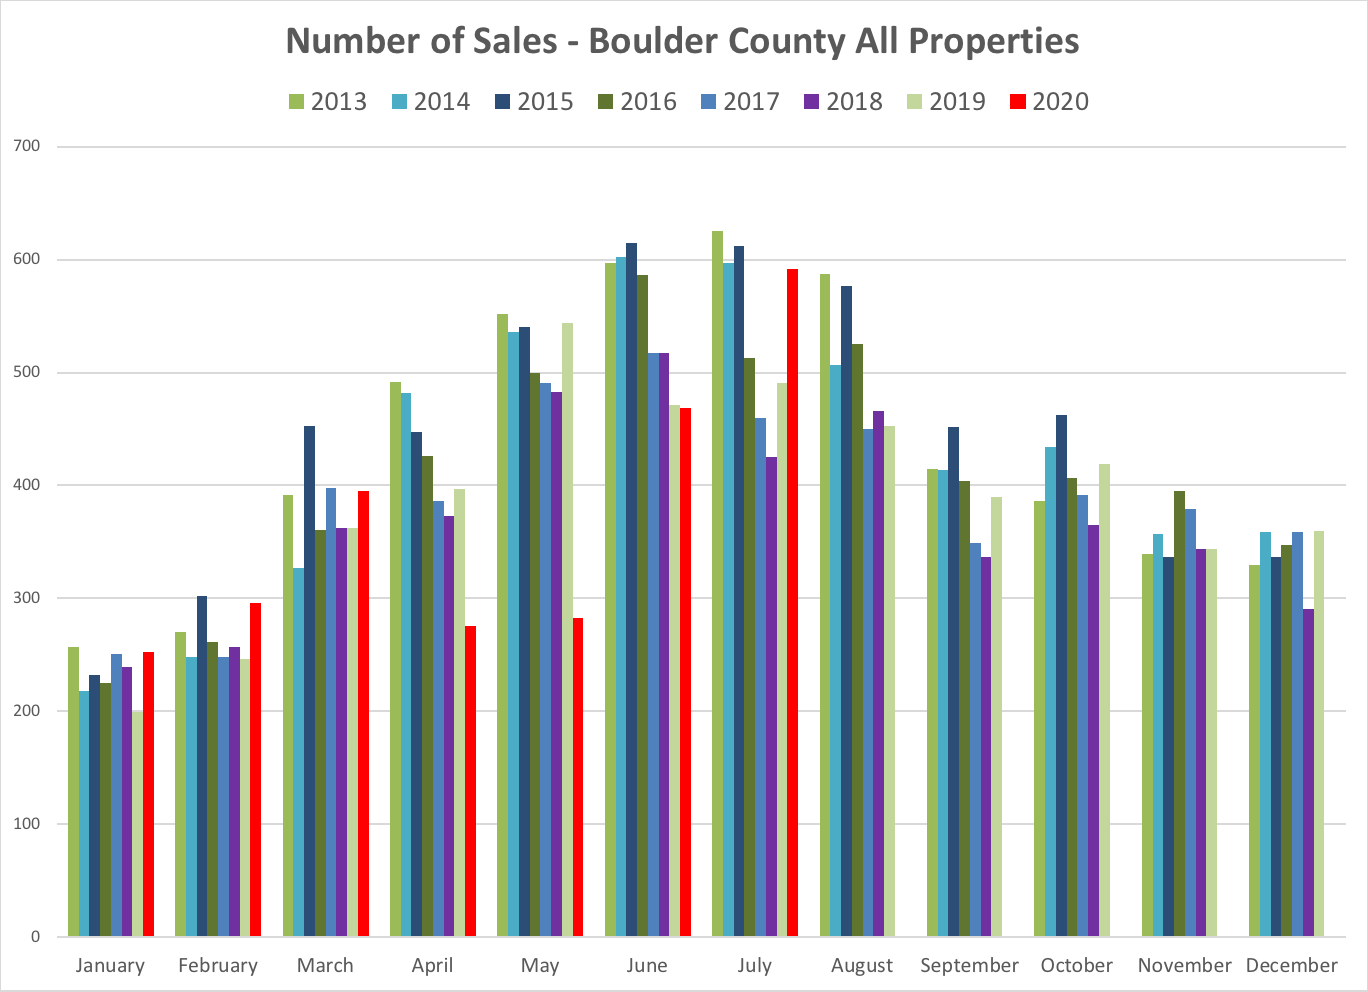
Sales were up 20% in July from a year ago.
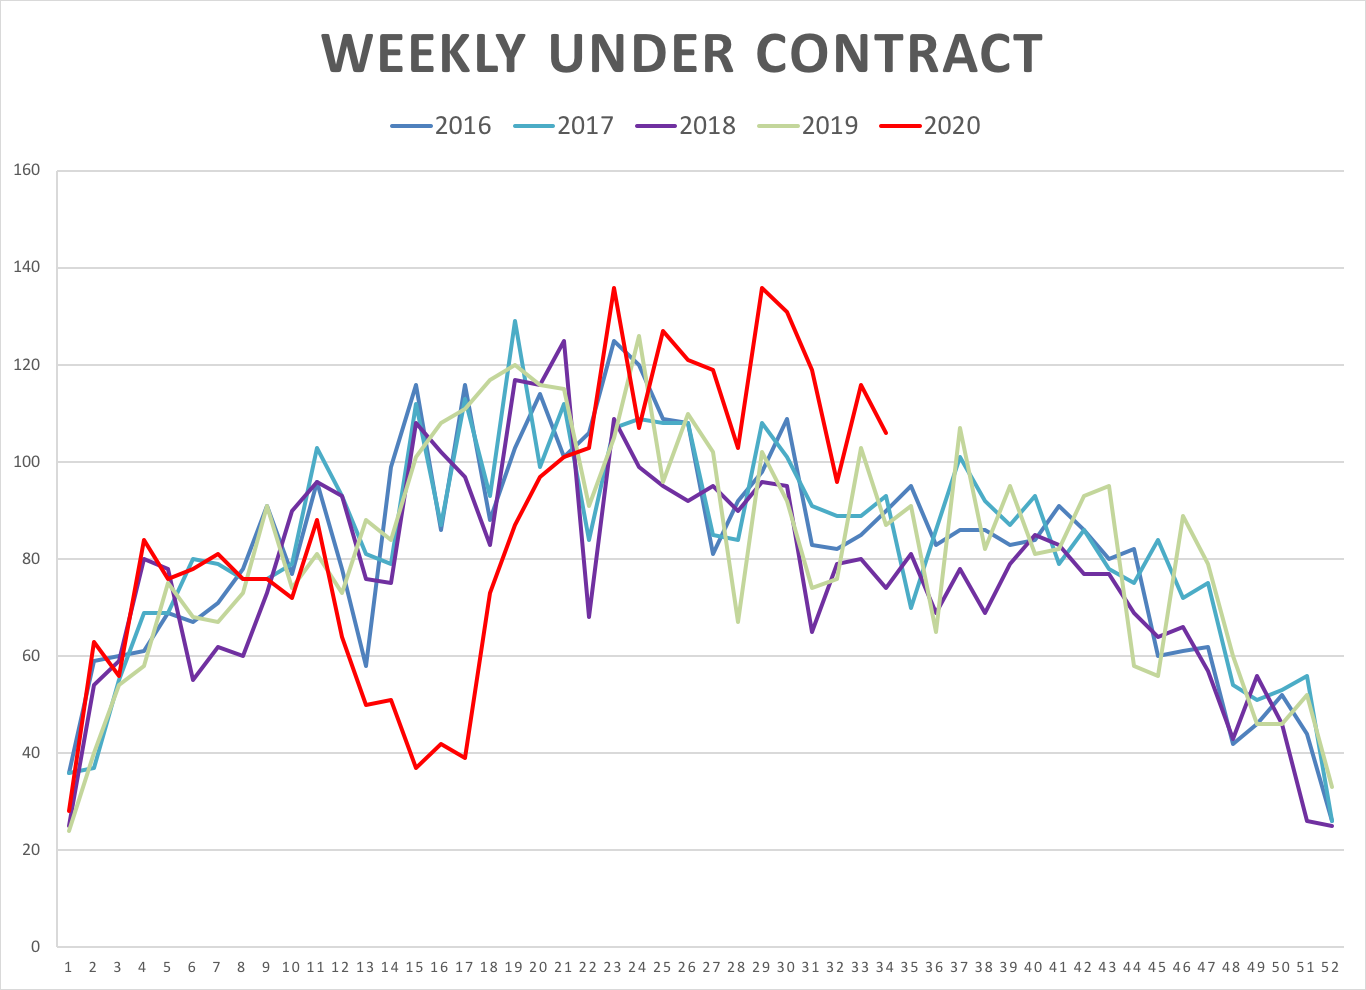
This graph shows the number of properties that have gone under contract on a weekly basis over the past five years. The red line shows the trend bucking path of this years market. This is a good indication for buyer demand.
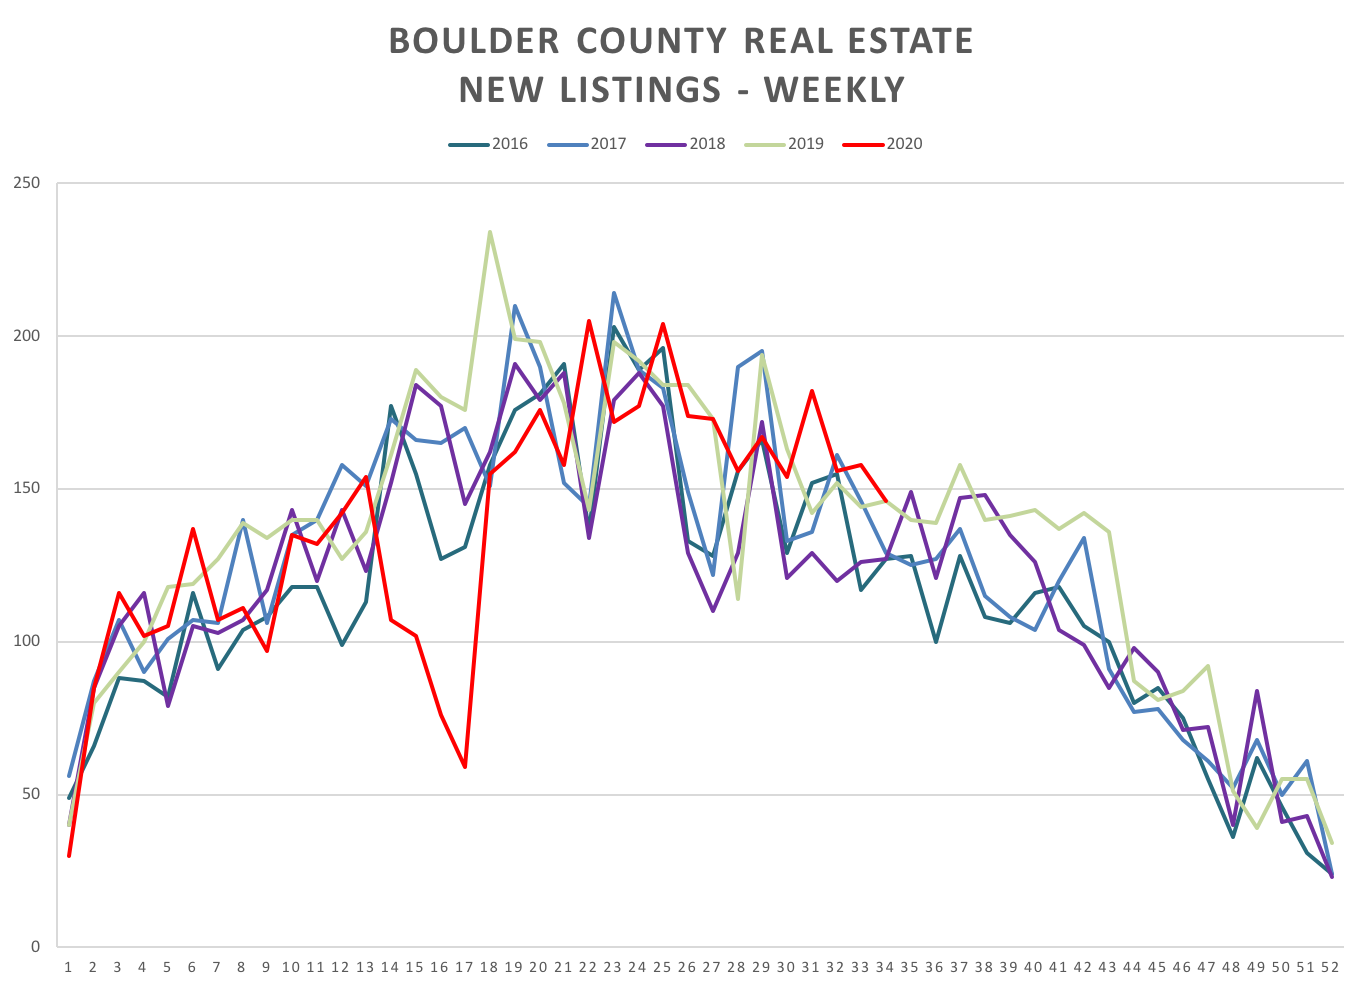
This graph shows the number of new properties to go onto the MLS on a weekly basis. If you compare the red line here (supply) with the red line in the previous graph (demand), you can see that the number of active listings is falling. This results in shorter days on the market and upward pressure on prices.
Click on the slideshow below to see the entire picture for the month and see all 10 slides.

