by Neil Kearney | Jul 22, 2020 | Boulder County Housing Trends, Statistics
There were many questions as to how the real estate market would react to the pandemic. In Boulder County we are getting the short term answer. Sales have recovered quite nicely, and activity is back up to normal levels for this time of the year. Overall, inventory is dropping back to pre-2017 levels and with nearly half of active listings already being under contract inventory is low in some sub-markets and price ranges. The lower end of the market continues to outperform the higher end. Price reductions have been increasing in recent weeks as sellers who are not finding traction in the market find ways to compete in the market. What will happen in the long term is still an open question. Here are some of the many possibilities.
- Locally will we see more people drawn to the area from large urban areas?
- Will the importance of housing (after being stuck at home for months) translate into more sales?
- Will millennials continue to be a driving engine in the lower end of the market?
- Will we see more relationships ending? Resulting in the need for more housing?
- Will the economy continue to improve even after the unemployment benefits and other stimuli run out?

by Neil Kearney | Jun 8, 2020 | Boulder County Housing Trends, Statistics
There is a lot to process this month. Definitely not just a continuation of our usual spring market. Sales are down significantly compared to past years (down 48% in May), but this is due to the forced showing moratorium. Sales are a lagging indicator. Looking forward, we have seen a nice rebound in the market in the last few weeks. Showings have increased and the number of contracts written are surprisingly strong. I’m still seeing much more activity in the lower price ranges and not as much in the luxury range, but overall I’m encouraged with the strength in the recovery so far.
The University of Colorado and its students have a big ongoing impact on our local market. CU has announced a hybrid model to conducting their fall classes, using a mix of online and in-person classes. It will be interesting to watch how this will affect the demand of housing as time goes forward. For now, I hope you find the slides below informative.
by Neil Kearney | May 11, 2020 | Boulder County Housing Trends, Statistics
We are now two months into the beginning of the financial impacts of the 2020 Pandemic. Unemployment has spiked to levels not seen in more than half a century and some states (including Colorado) are finding ways to safely get back to work. Real estate sales were down 30% in April and we will see large decreases (compared to past years) in the coming months. Showings were again allowed starting in early May and we are seeing some activity return to the market. But, like the economy in general, it will not be a straight- line recovery. I’m carefully watching showing activity and contracts written to see if buyers are coming back to the market. I’m seeing more activity in the lower price ranges and not as much in the luxury range.
After scrolling through eight slides below you will have a much better understanding of where the market is in terms of showing activity, new listings, inventory and other measures of the market. As always, please feel free to contact me directly if you have questions.

by Neil Kearney | Apr 6, 2020 | Boulder County Housing Trends, Statistics
When you look to the future and predict where the market will go, rarely do we think about large outside influences like a global pandemic. But here we are. The health crisis has caused a global financial crisis. How deep this recession will be won’t be known until we get back to work and see how quickly the workforce gets reabsorbed back into jobs. The housing market was just coming into the most active time of the year so many plans are paused if not changed. Right now I’m seeing most of the in-process transactions make it to the closing table (although definitely not all), but we are definitely seeing a huge drop in showings and new contracts written. It will be interesting to see if the busy time of the year is just delayed or if the normal bubble of activity just pops for the year. For now we are seeing some activity in the lower price ranges in our market and very little in the upper price ranges.
Here are a few of the graphs for the month. But to get the entire picture see the annotated slideshow below.


by Neil Kearney | Mar 10, 2020 | Uncategorized
Amid other pressing matters, here is a quick update on the Boulder County real estate market and statistics using the data available at the beginning of March. The real estate market has been very strong over the last three months. Sales are up double digits from a year ago, inventory is again falling and there have been many multiple offer situations so far this year. Going forward it will be very interesting to see how the worldwide health situation and the stock market drop and volatility will affect the local real estate market. In the short run interest rates will be positively affected. My guess is that higher priced homes will feel a definite slow down and lower price points won’t be as affected. Low mortgage rates help those with high mortgage balances the most, but locally, buyers of high priced homes tend to also have high down payments and money invested in the stock market.
See the ten slide, slideshow below for more commentary and details.
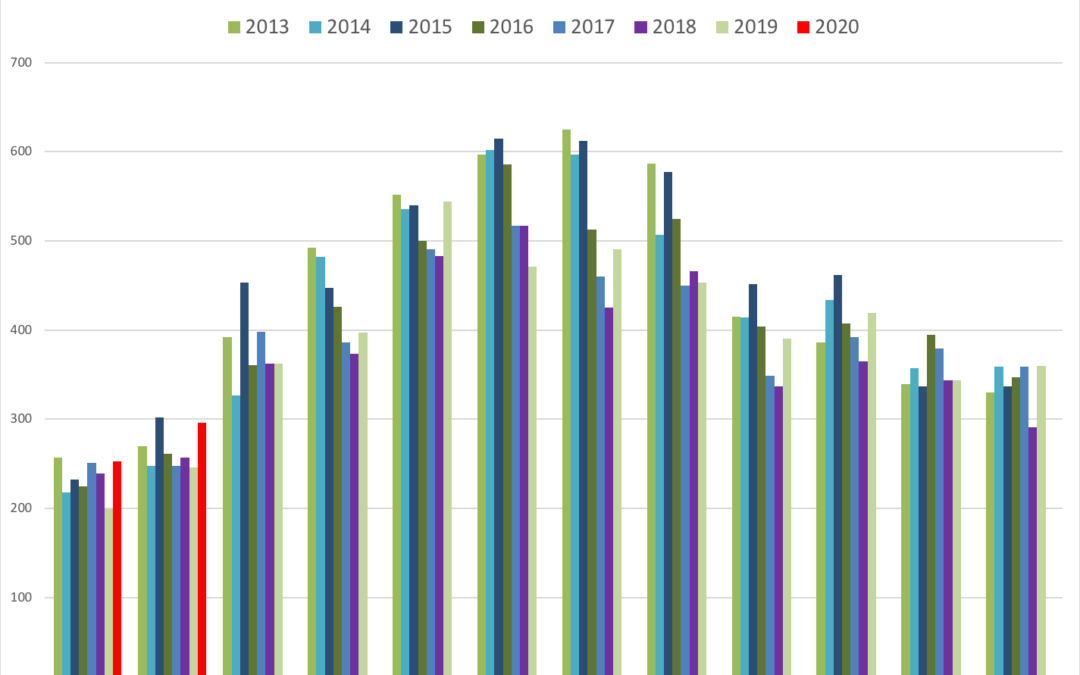
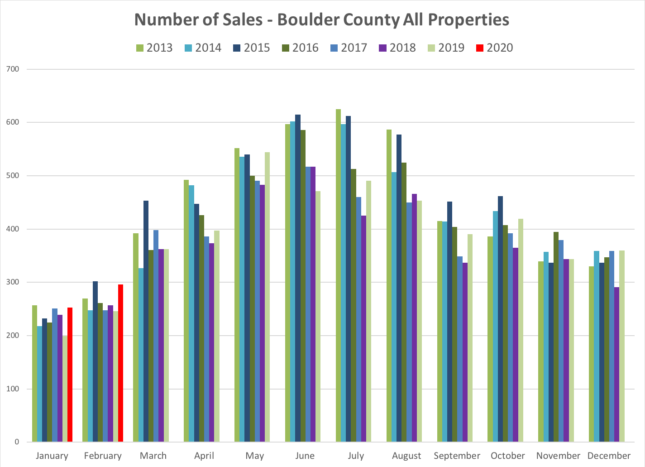
The first graph below shows sales on a monthly basis over the past eight years. The red bars on the left side show the strong sales recorded so far this year compared to past years.
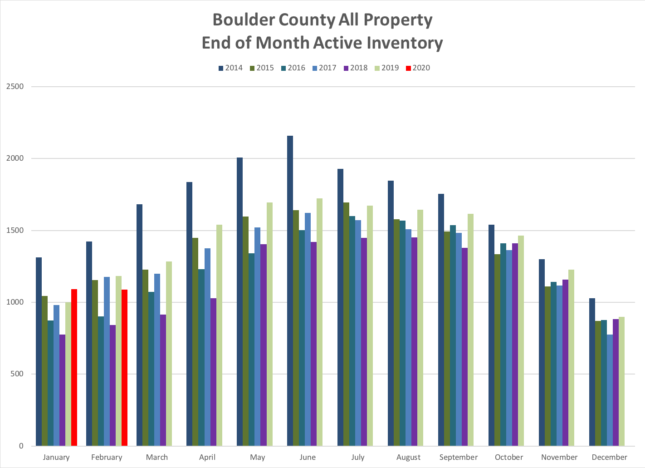
The graph below shows the total number of homes available at the end of each month since 2014. After a showing gains in inventory in 2019, we are seeing a drop due to strong sales.