by Neil Kearney | Apr 9, 2021 | Boulder County Housing Trends, Statistics
WOW! We are seeing unprecedented market conditions in the Boulder County real estate market. A strong and fast moving, sellers’ market is causing a spike in prices. Inventory is still low and at the end of March 69% of the ”on market” homes were already under contract. Two years ago at this same time 43% of listings were under contract. Most well priced homes are going under contract very quickly with multiple offers. It’s not uncommon for buyers to waive the right to object to a low appraisal and taking houses in ”as-is” condition.
55% of the sales in March exceeded the list price of the home. The average premium over the list price was 6% or almost $42,000! Appreciation is moving quickly!
Take a look at the annotated slide show below to get more details and see the trend charts for the month.
by Neil Kearney | Mar 8, 2021 | Boulder County Housing Trends, Statistics
We continue to see a very fast moving, sellers’ market with properties going under contract very quickly and multiple offers as the norm, not the exception. Prices are rising quickly because of the competitive nature of the market and appraisals are having a hard time keeping up. Appraisals are inherently backward looking and buyers searching for properties are in the present or are forward looking (“if I don’t get this one how much will I need to pay for the next listing?”). During February, 45% of the sold properties closed at a price above the list. These above list sales averaged 4.5% over the list price. The the top premium paid during February was 17.7% for a house near Chautauqua that sold for $1,531,000.
Scroll through the slides below to get a good indication on the details

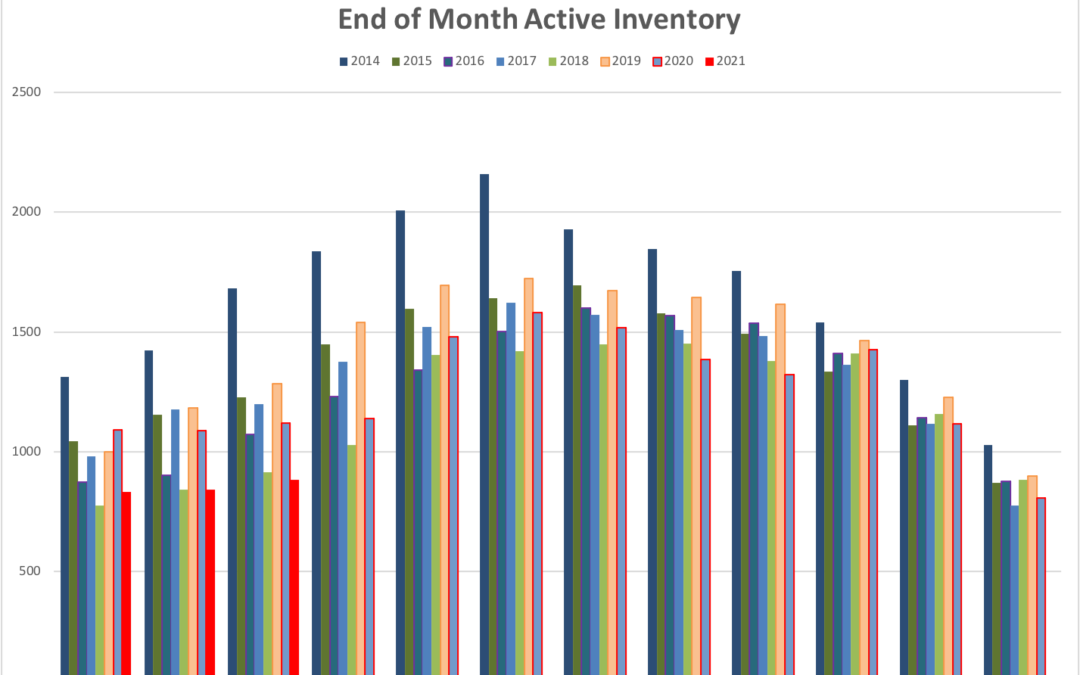
by Neil Kearney | Feb 8, 2021 | Boulder County Housing Trends, Statistics
We have one of those fast moving, frenzied markets that we see from time to time. There is a big line (virtual, not literal) of buyers waiting for new listings and when a new one comes out many showings take place over the first few days. If the house is priced well and is functional, then it is very common to see multiple offers.
The number of sales in January decreased by 2.8% compared to the prior year. This was due to low inventory not lower buyer demand.
During the first 37 days of 2021, 31% of the sales closed for above asking price. For those houses that sold above list price the average premium paid was just over $22,000 or 3.5% above list price. The largest premium paid was 18% for a house near Chautauqua (I didn’t think it was that great). Given what I’m seeing right now, I would expect the numbers for February to show an even larger percentage of above list sales and larger premiums paid.
To give a full picture – 50% of the sales up until today closed for below the asking price. The average negotiation off of the list price was 3.2%. 19.5% of the sales closed at the list price.
The 10 slide annotated presentation below gives a broader picture of the monthly sales.

by Neil Kearney | Jan 14, 2021 | Boulder County Housing Trends, Statistics
2020 Boulder County Real Estate Market Report Overview After some uncertainty in March, April and May, 2020 turned out to be another strong year for the Boulder area real estate market. A year ago, I wrote how we were moving toward a more balanced real estate market,...

by Neil Kearney | Jan 5, 2021 | Boulder County Housing Trends, Statistics
December is a good indicator month. Activity is always at its slowest, but when I look at the strong under contract percentage (54%) and the low inventory (807 in all of Boulder County), it tells me that we are going to have a quick and strong start to the 2021 selling season. There are many buyers out there just waiting for houses to come on the market (picture a busy mall parking lot with cars trolling for recently vacated spaces). Over the second half of the year, we saw strong demand and and low supply. This led to more multiple offer situations and rising prices. I expect to see more of this as 2021 begins. Browse through the full slideshow below for more details on the latest Boulder County real estate statistics and trends.

