
Even with so much economic and political uncertainty, our local real estate market is seeing great activity. The stock market and housing market have fully recovered from the initial shock of the pandemic and we are seeing demand (sales) outpace supply (new listings). This results in positive pressure on prices as well as shorter time on the market. Lifestyle areas with a vibrant economy, like Boulder, are attracting people from more crowded parts of the country.
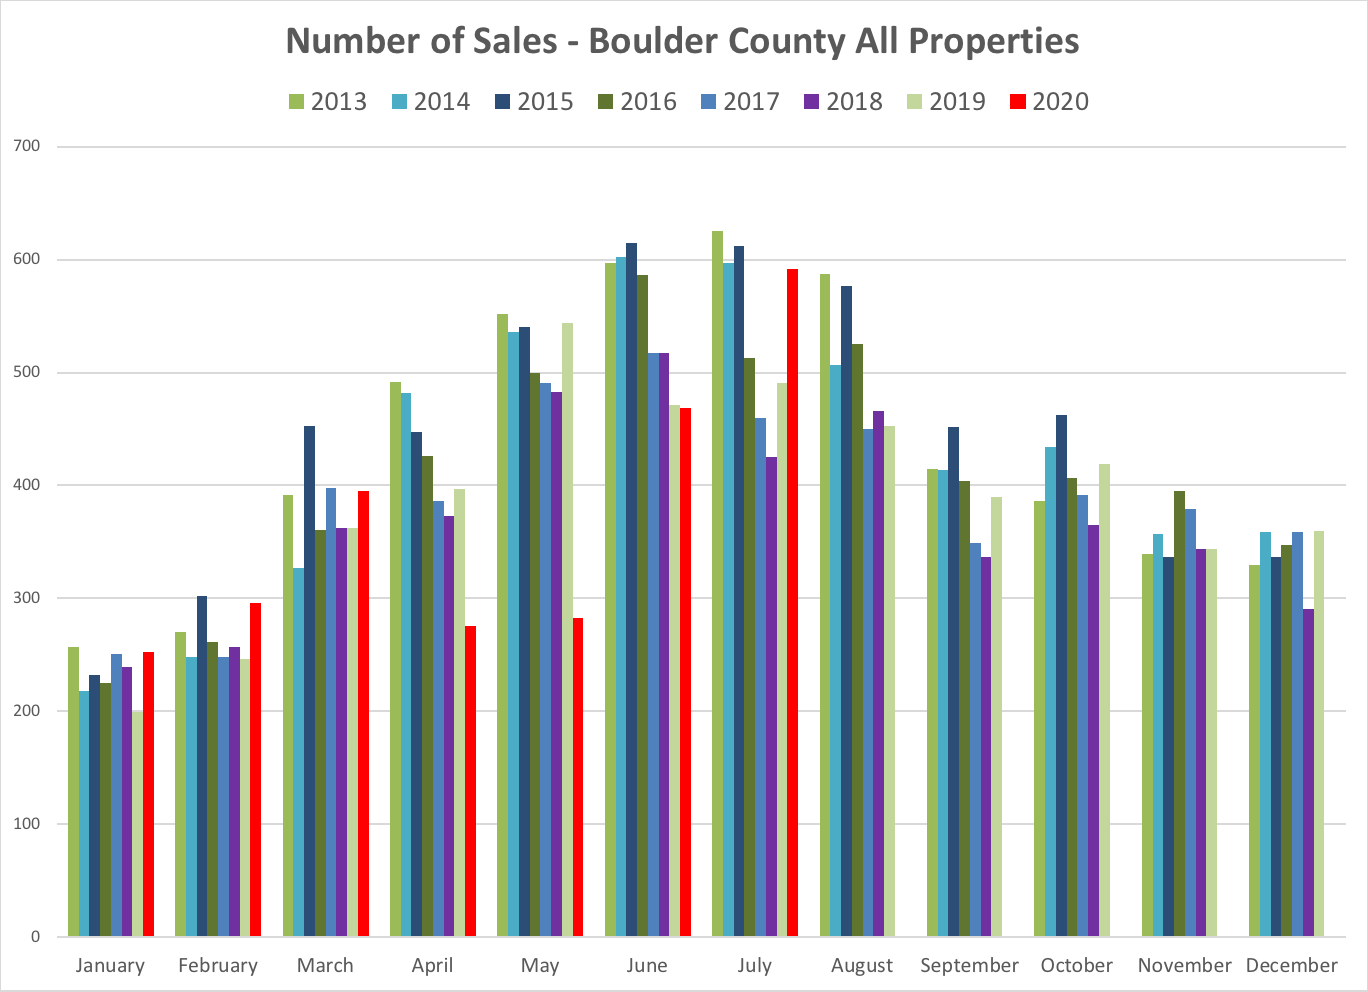
Sales were up 20% in July from a year ago.
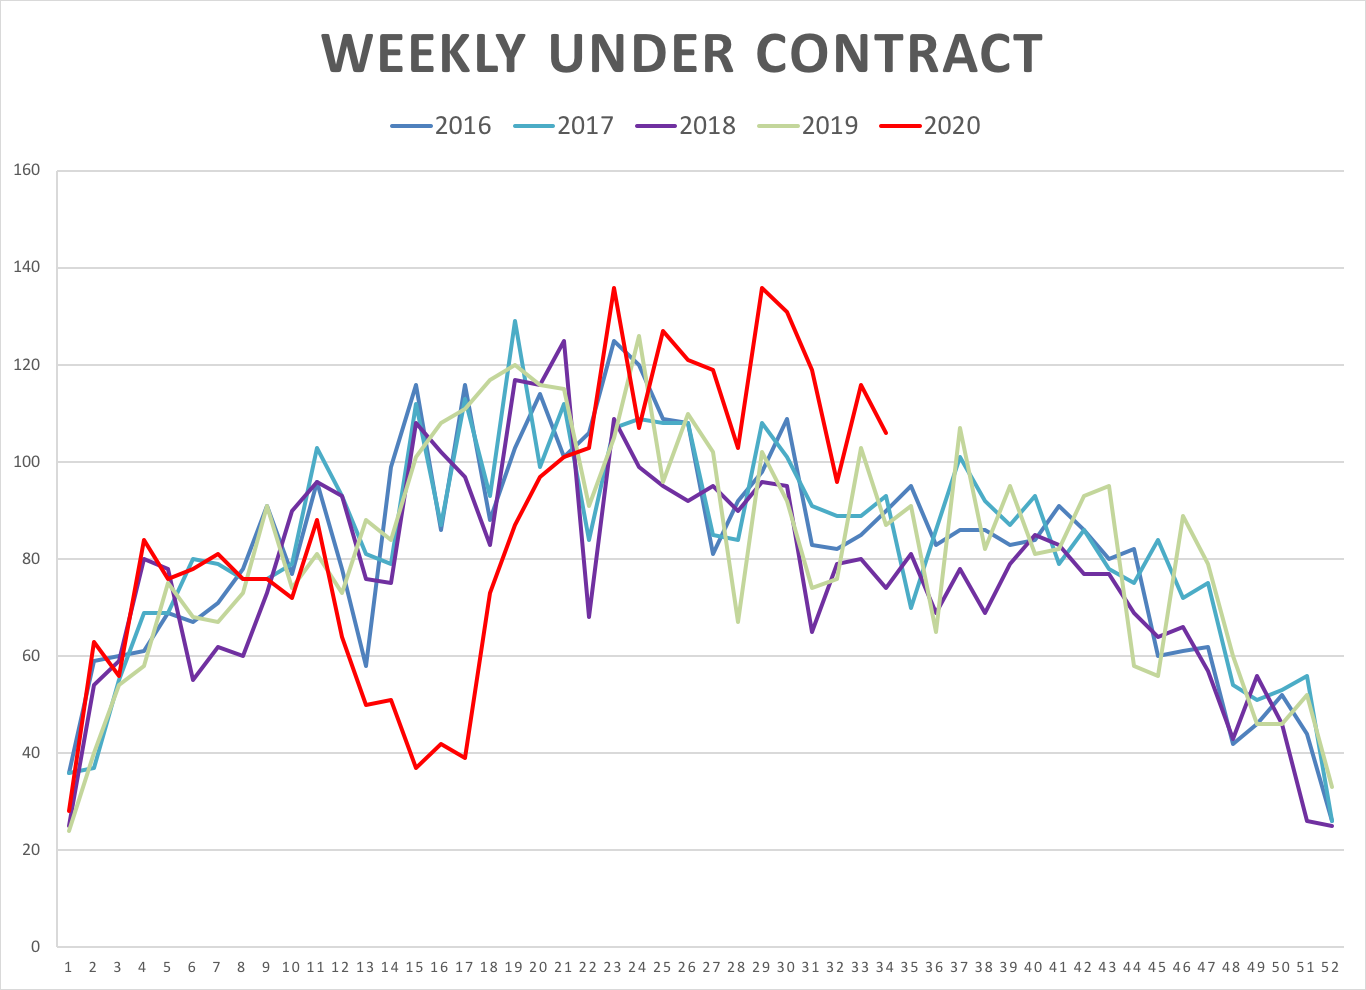
This graph shows the number of properties that have gone under contract on a weekly basis over the past five years. The red line shows the trend bucking path of this years market. This is a good indication for buyer demand.
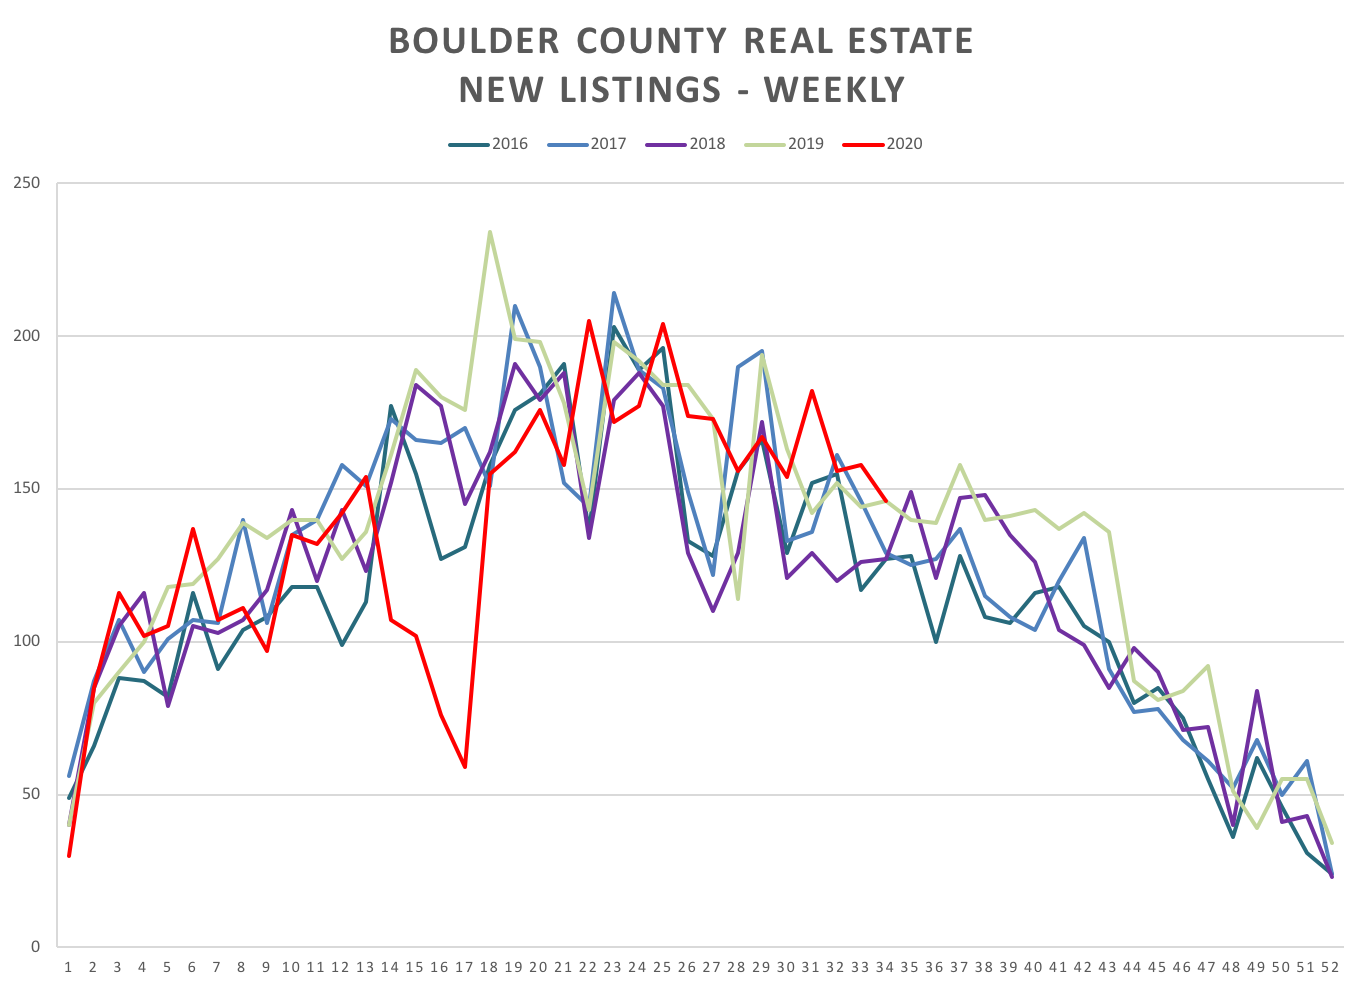
This graph shows the number of new properties to go onto the MLS on a weekly basis. If you compare the red line here (supply) with the red line in the previous graph (demand), you can see that the number of active listings is falling. This results in shorter days on the market and upward pressure on prices.
Click on the slideshow below to see the entire picture for the month and see all 10 slides.

