Finding Strength In The Boulder Real Estate Market
Last summer, after the market quickly changed from sizzling to simmering, there was speculation that the high interest rates were going to spiral the market into a big correction. There have been some changes in the market, but the worst case scenario predictions have not come to pass. Today, I will give an overview of the market as well as analyze the the Boulder County real estate market by price. Yes, there is a difference!
Overview
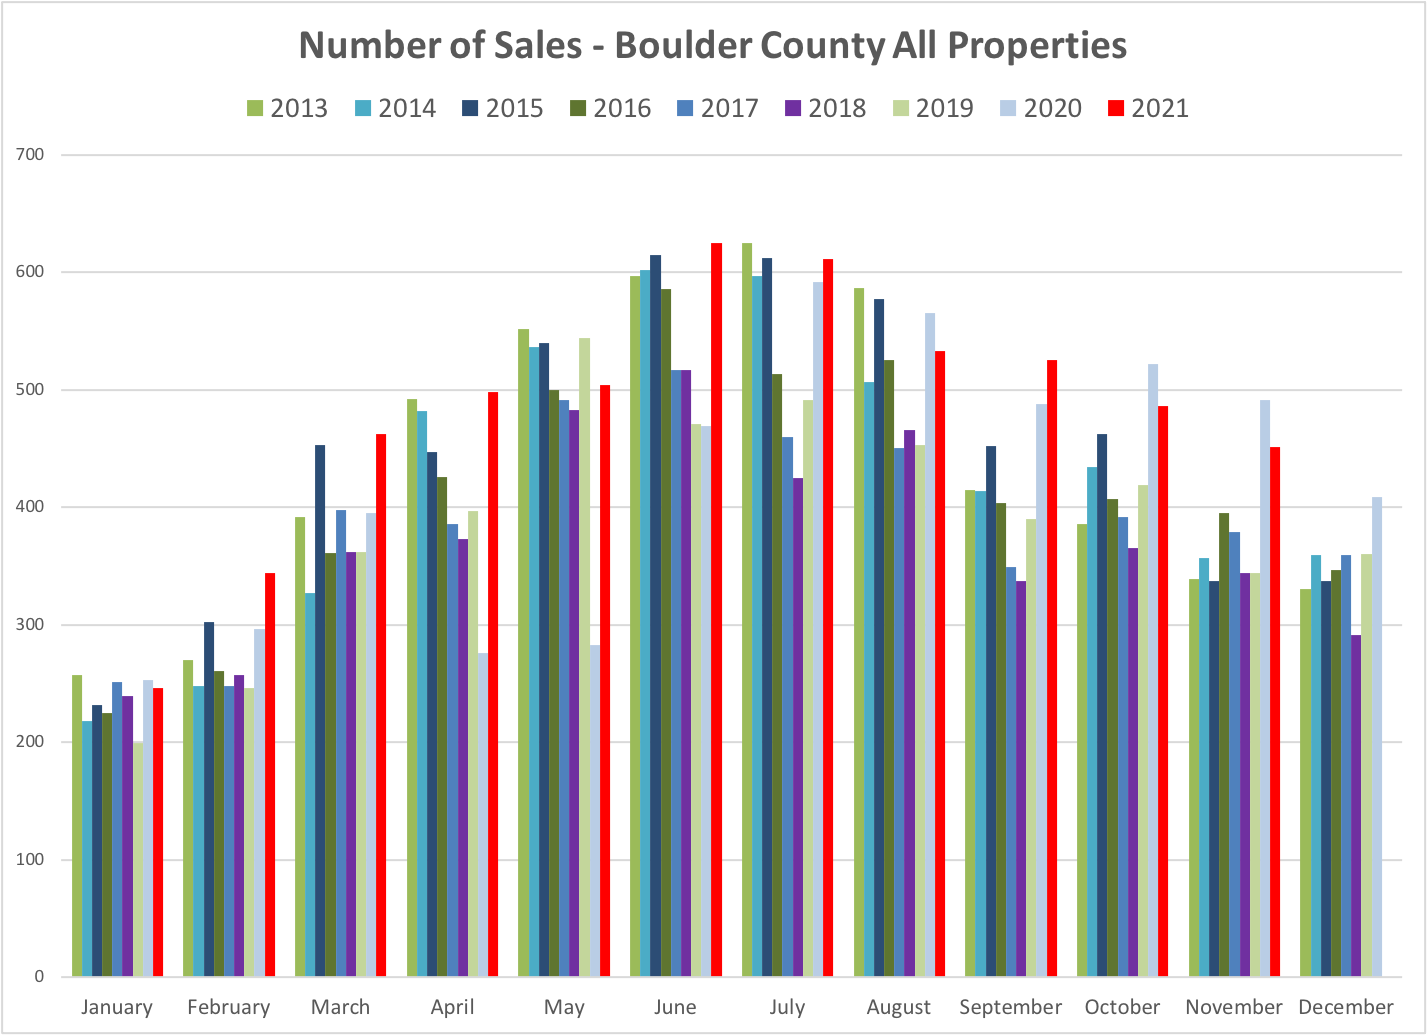
The main outcomes of the recent market shift have been fewer sales. High interest rates (upper 6’s at this writing) has suppressed both the supply of listings as well as the number of buyers. Sellers who may have considered a move are reconsidering once they realize that they would be giving up their current low payment with its low interest rate and stepping up to a payment significantly higher for the same priced home. Many would-be sellers are deciding to stay where they are. Homebuyers seem to be adjusting to the initial shock of interest rates that have more than doubled in the last 18 months, but with prices holding steady, affordability is a big concern. Fewer buyers are able to qualify for the properties they once did. These happen to be the ones they aspire to buy. But a subset of possible buyers is still ready, willing and able. Cash is king and there is a lot of cash flowing into real estate.
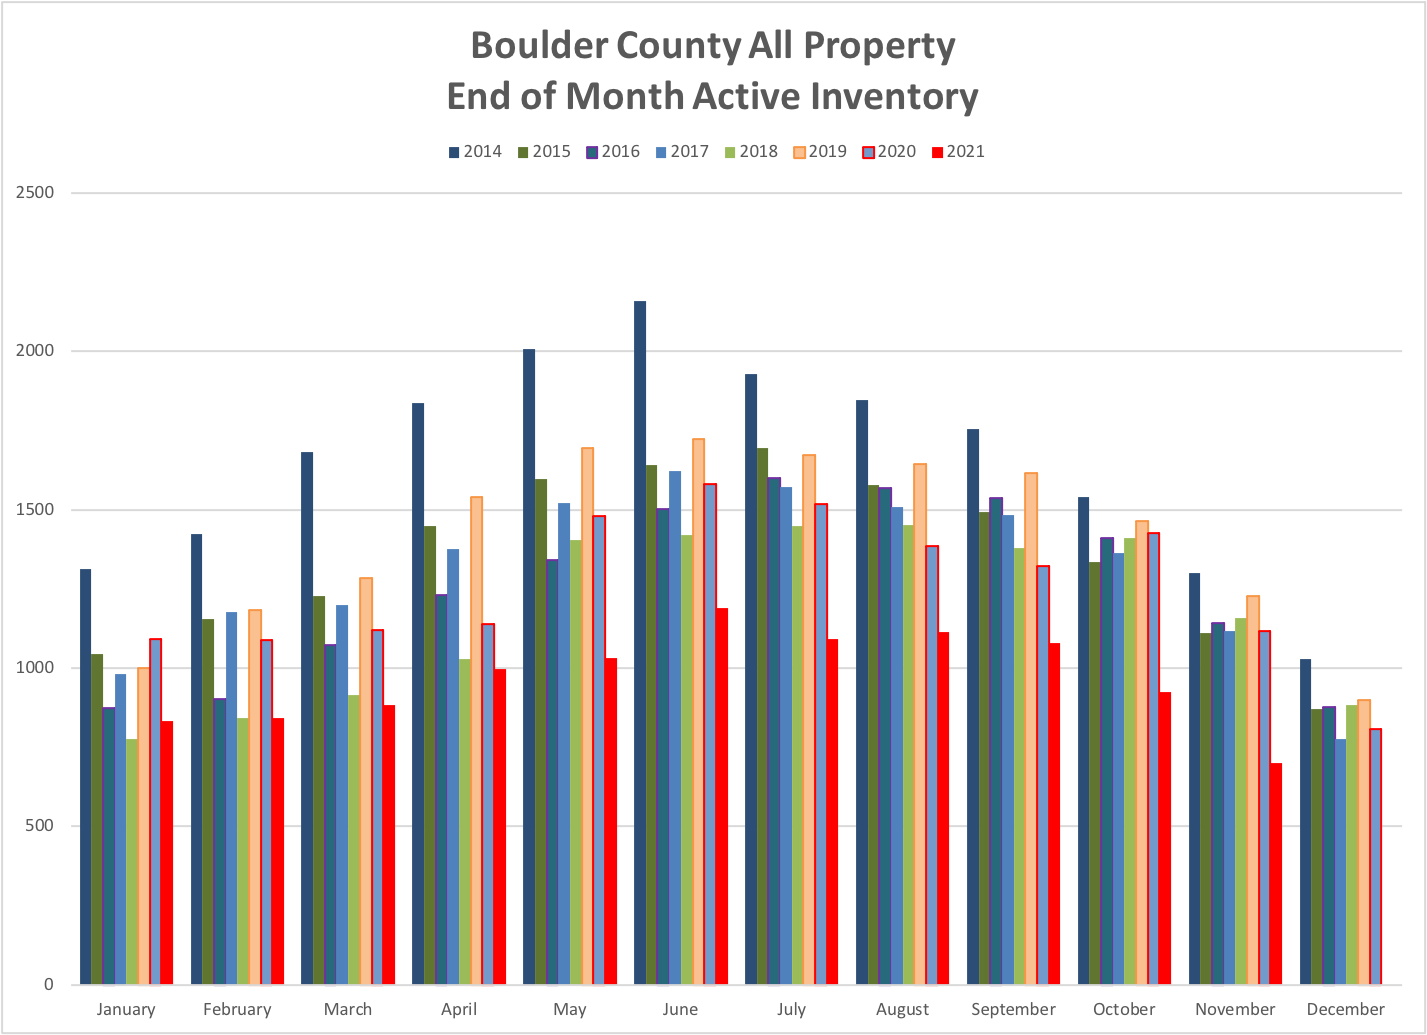
With both supply and demand reduced the market is fairly balanced. Inventory is rising off of last years rock bottom levels, but it is still well below normal. Since inventory is not accumulating prices are mostly stable and attractive properties are still selling fairly quickly. In February, the average time it took to put a home under contract that made it to the closing table was around 55 days. Up from the low 20’s last year.
Breaking It Down By Price
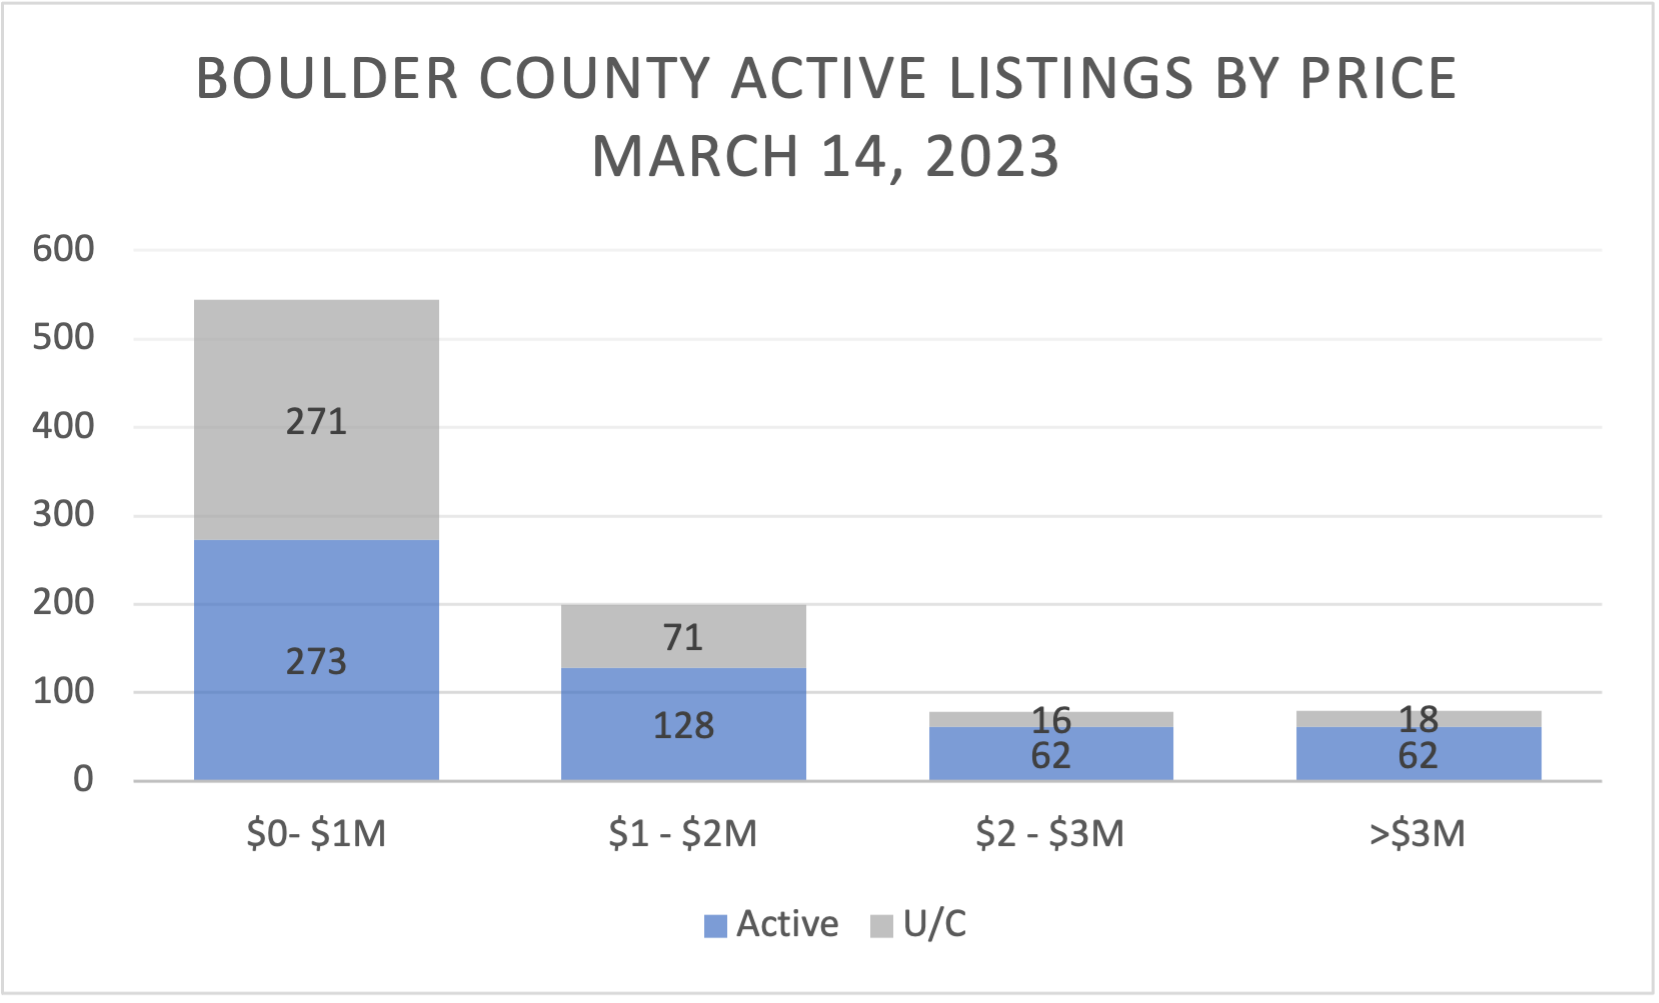
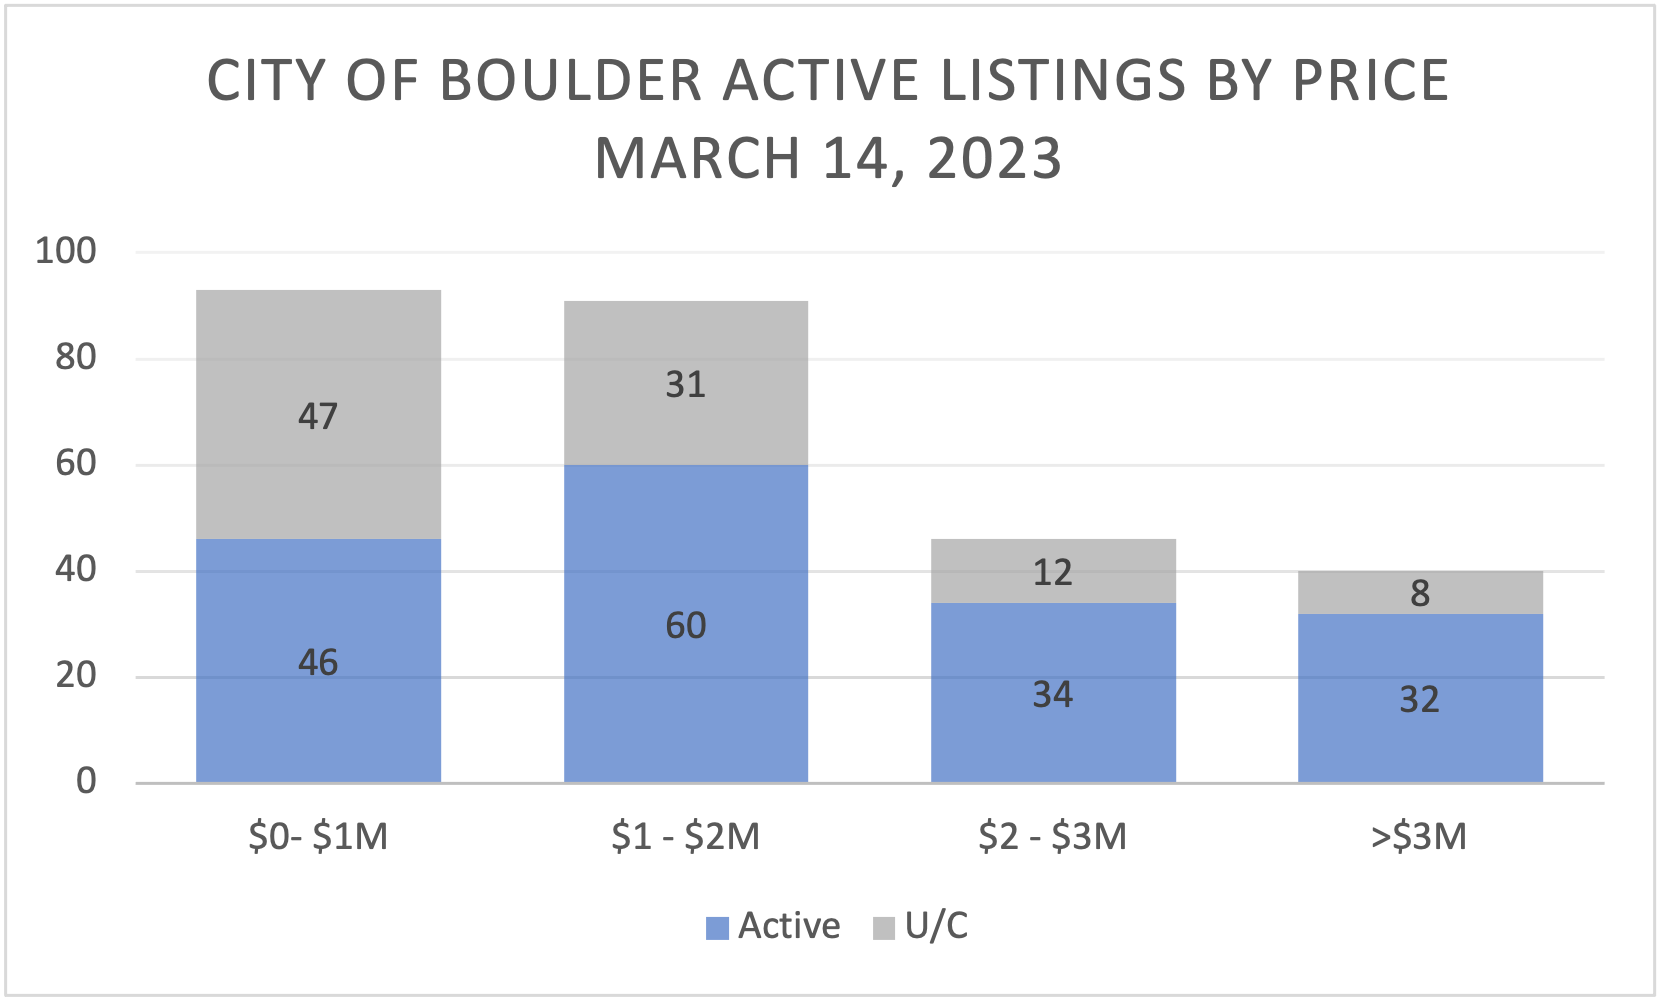
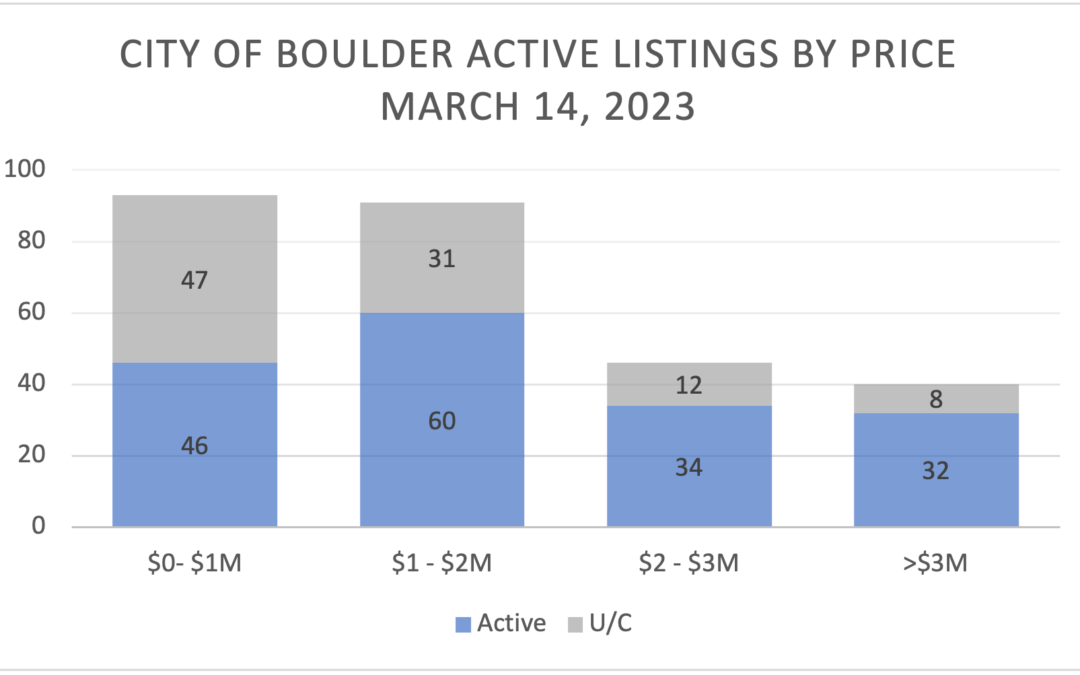
This chart shows the breakdown of listings by price. The blue half shows the available properties and the gray half shows the properties that are already under contract.
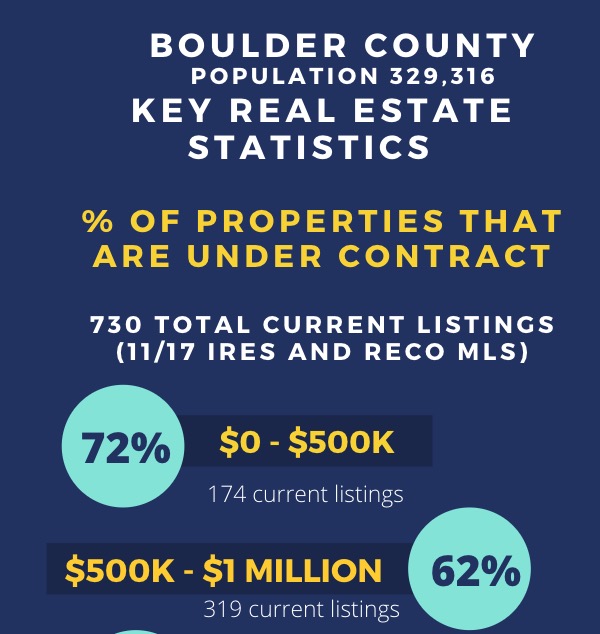
Boulder County has a wide scope of properties representing a huge range of prices. Currently there are 983 listings ranging from a 640 square foot cabin in the mountains in need of a septic tank to a 13,000 square foot home (do we still call it that?) on 115 acres listed for $25,000,000. Clearly, not all properties are equivalent and therefore, big sweeping statements about the market are not one-size-fits-all. Let’s break it down a bit. This time by price.
Boulder County
| Boulder County | Active | All | U/C | U/C % | Sold | Months of Inventory | SP:LP | DTO |
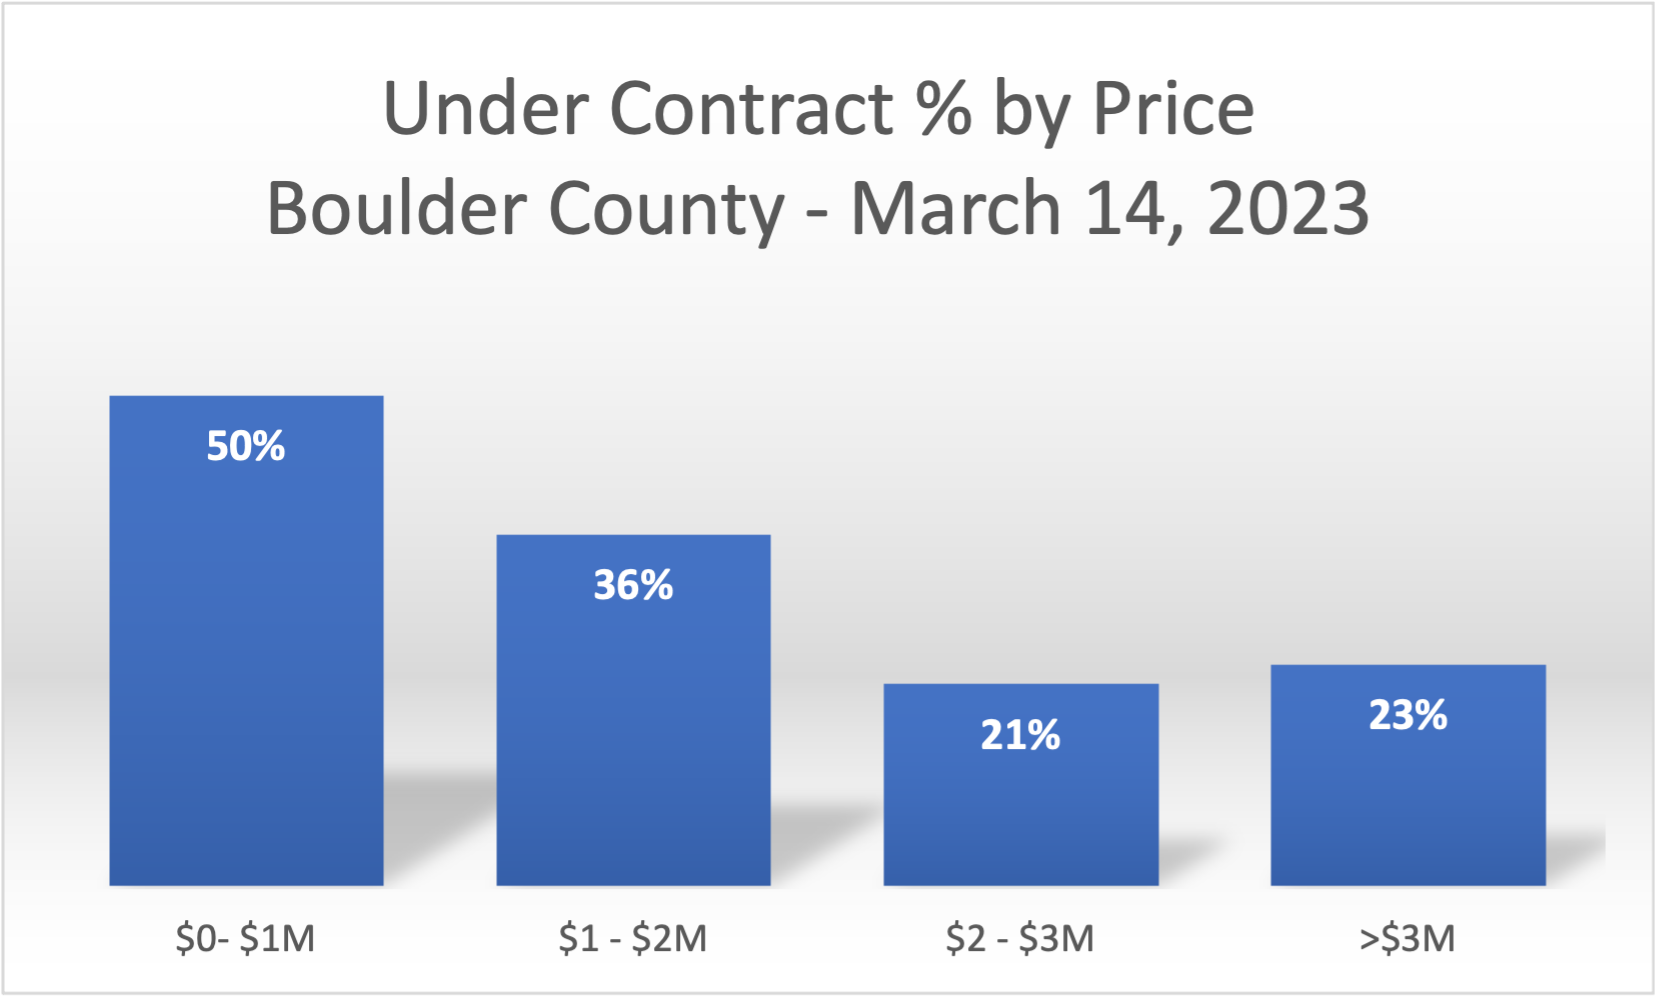
| $0- $1M | 273 | 544 | 271 | 50% | 471 | 3.5 | 99% | 45 |
| $1 – $2M | 128 | 199 | 71 | 36% | 101 | 5.9 | 98% | 41 |
| $2 – $3M | 62 | 78 | 16 | 21% | 33 | 7.1 | 96% | 41 |
| >$3M | 62 | 80 | 18 | 23% | 14 | 17.1 | 96% | 224 |
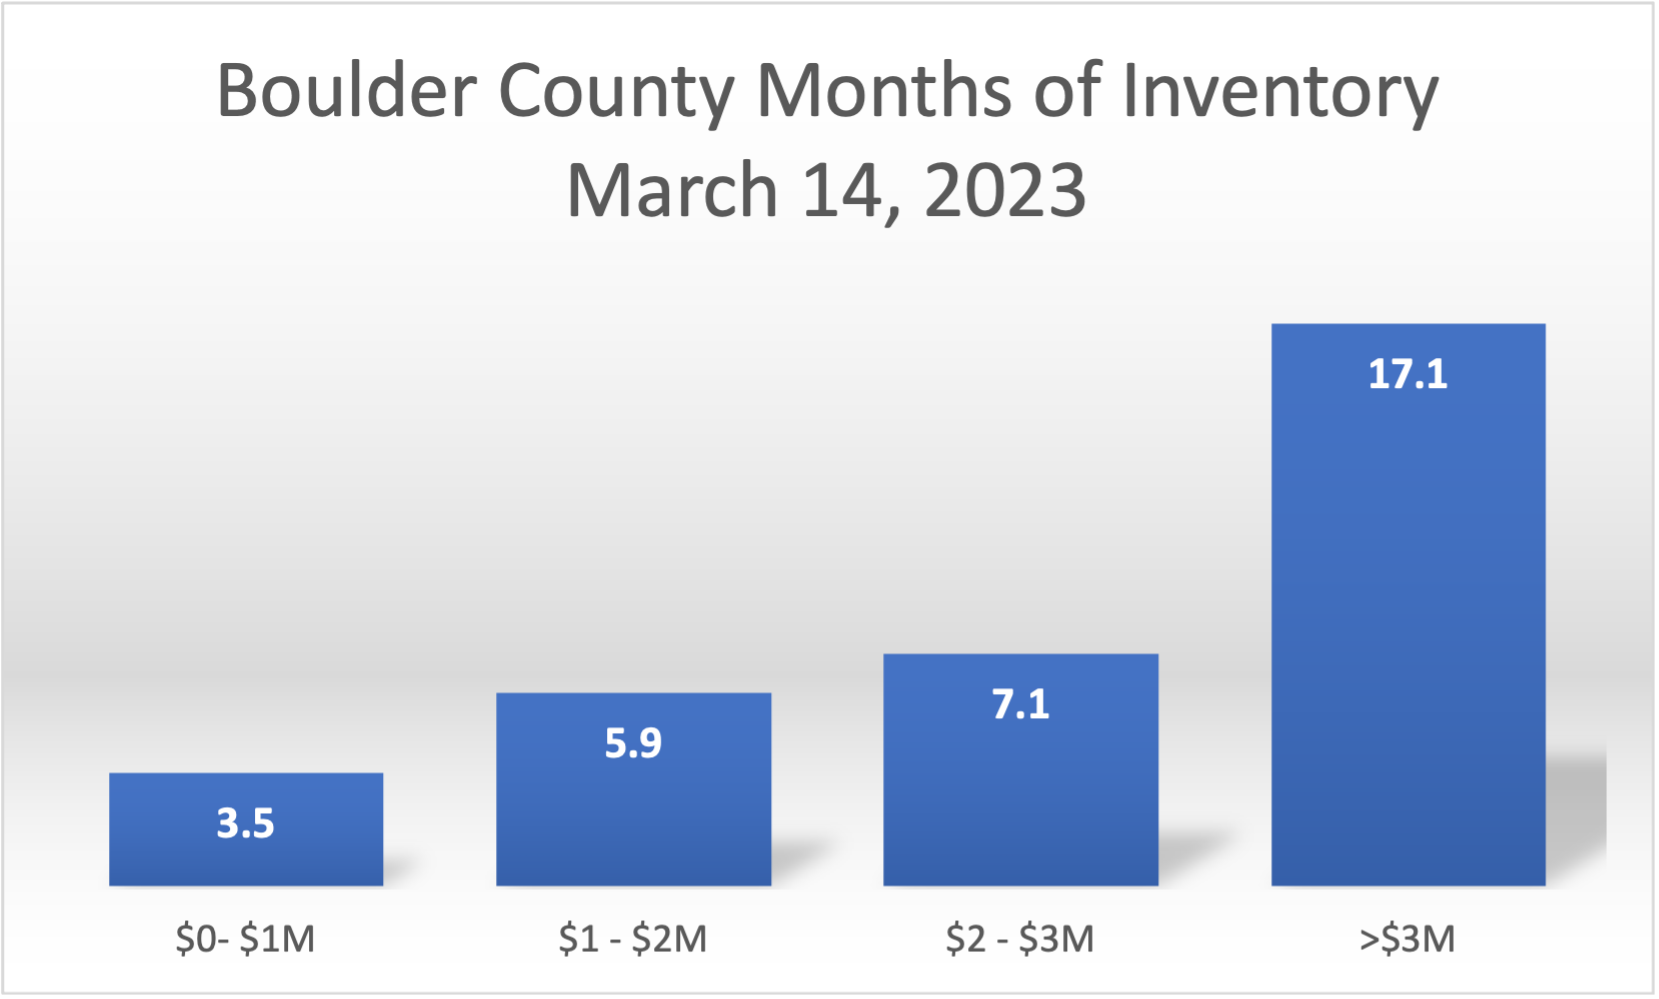
U/C% = # of homes that are currently under contract / # all current listings. – Months of Inventory = # of months it would take to sell all current listings if sales continued at their current pace. – SP:LP = Sales price to list price ratio – DTO = Days to Offer
$0 – $1,000,000 The market for homes below $1 million is strong. Half of all current listings are under contract. Properties are selling within 1% of the asking price. At the pace of sales over the past three months, there is just 3.5 months of inventory on the market (4-6 months in balanced). Slightly a seller’s market. On average it’s taking 45 days to get a house under contract.
$1,000,000 – $2,000,000 In this price range, there are fewer listings and just 36% of those listings are under contract. With the average property selling at 98% of the asking price, prices seem to be still holding steady. Properties are staying on the market for 41 days before receiving a contract. At the pace of sales over the past three months, there is 5.9 months of inventory on the market. This is defined as a balanced market.
$2,000,000 – $3,000,000 There are just 78 listings in this price range. 21% of all current listings are under contract. Properties are selling within 4% of the asking price. At the pace of sales over the past three months, there is 7.1 months of inventory on the market (4-6 months in balanced). Slightly a buyer’s market. On average it’s taking 41 days to get a house under contract.
$3,000,000 and above There are 80 listings in this price range in Boulder County. 23% of all current listings are under contract, which is very strong. Properties are selling within 4% of the asking price. At the pace of sales over the past three months, there is 17.1 months of inventory on the market (4-6 months in balanced). This indicates a buyer’s market. On average it’s taking 224 days to get a house under contract. Given the current number of listings that are under contract I expect the numbers for inventory and days-to-offer to improve significantly in the coming months.
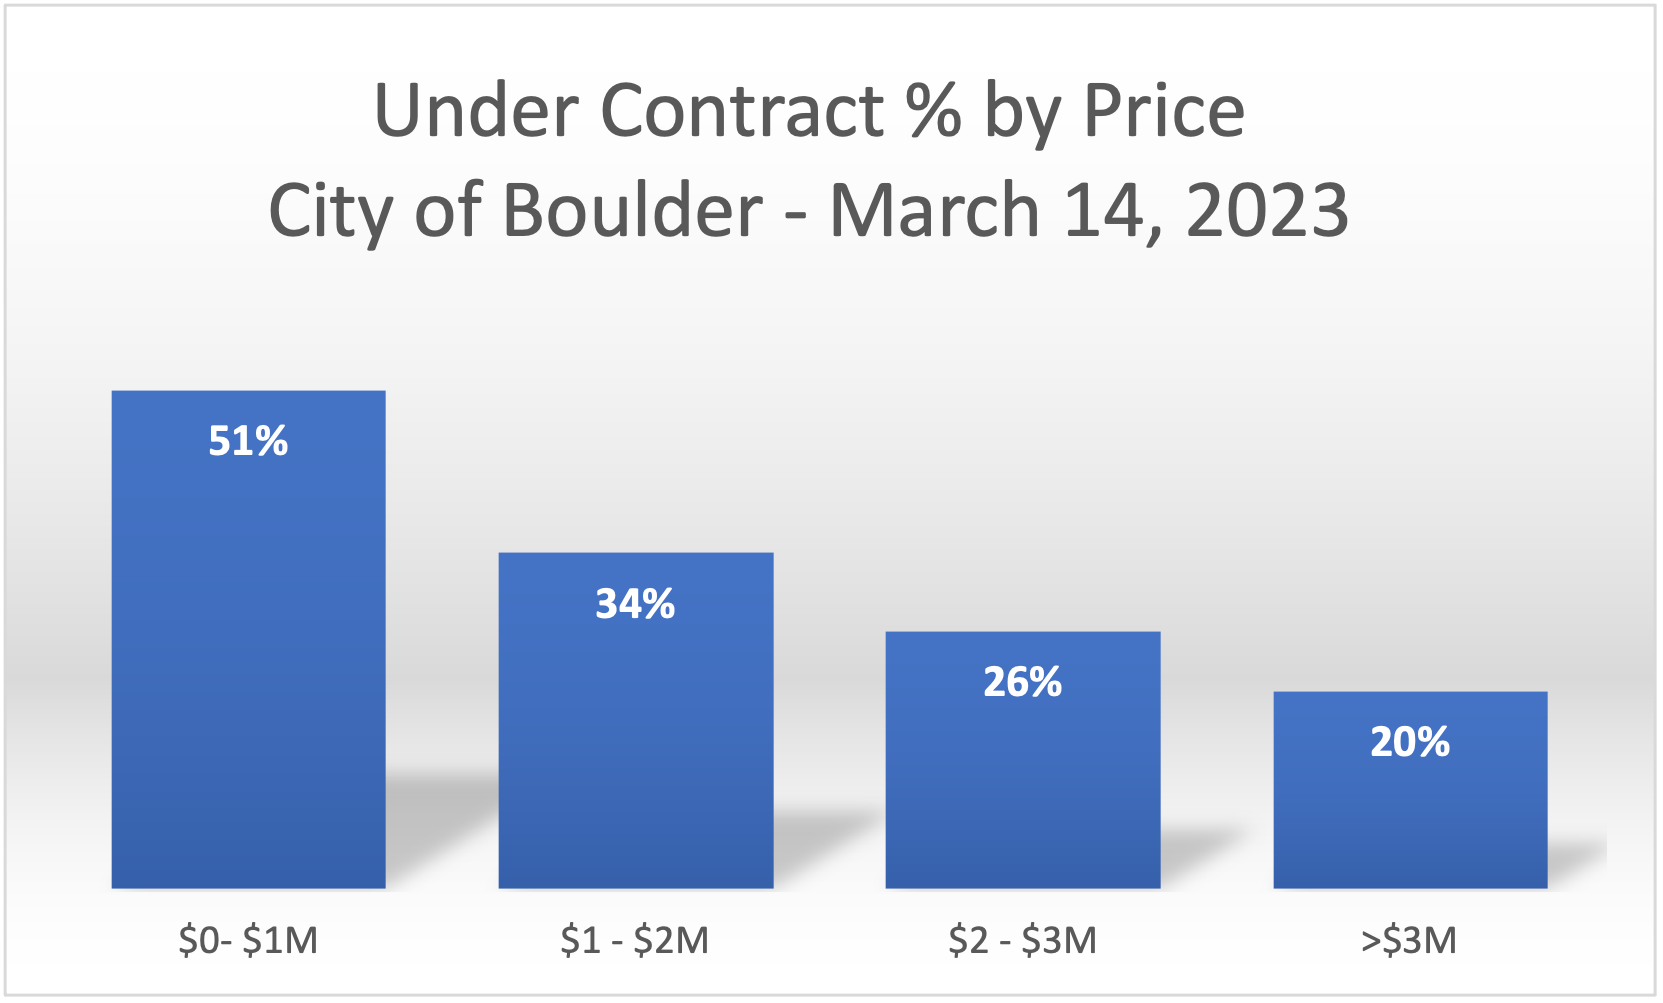
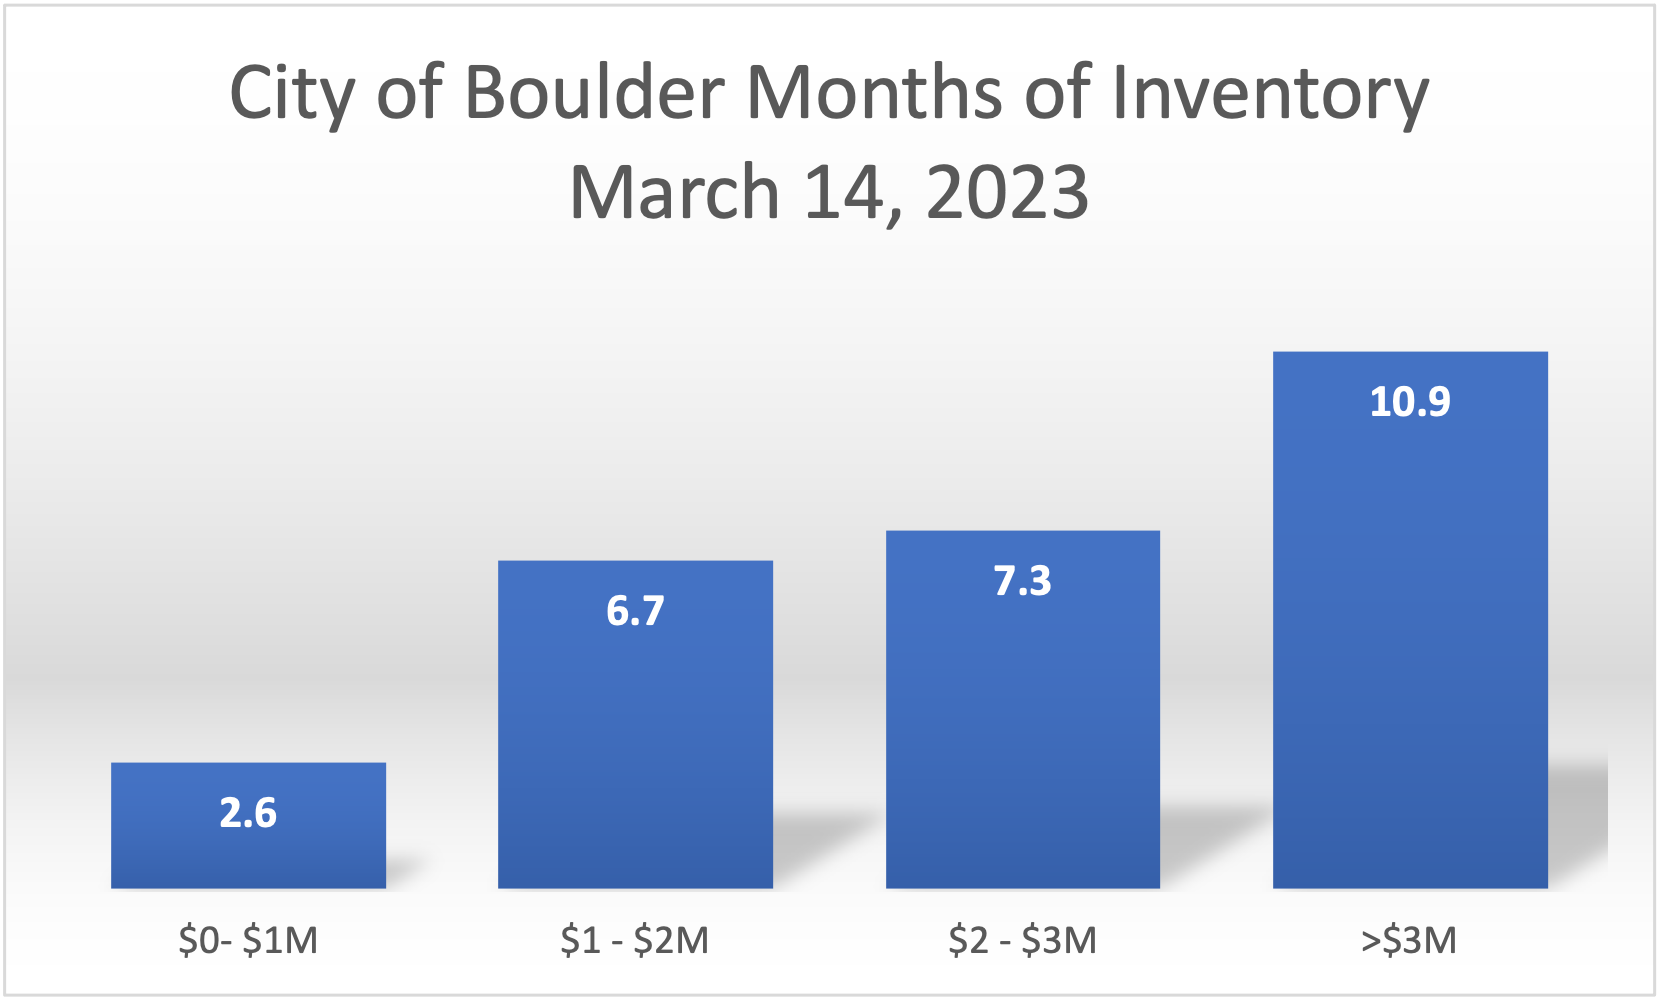
City of Boulder
| City of Boulder | Active | All | U/C | U/C % | Sold | Months of Inventory | SP:LP | DTO |
| $0- $1M | 46 | 93 | 47 | 51% | 109 | 2.6 | 99% | 38 |
| $1 – $2M | 60 | 91 | 31 | 34% | 41 | 6.7 | 98% | 29 |
| $2 – $3M | 34 | 46 | 12 | 26% | 19 | 7.3 | 97% | 50 |
| >$3M | 32 | 40 | 8 | 20% | 11 | 10.9 | 98% | 43 |
For a comparison, here are the same statistics for the City of Boulder only. They are mutually exclusive, the city’s statistics were included in the county’s. In general, these are very similar to the county as a whole. It’s a good market. Not a crazy nor a flat market.