by Neil Kearney | Feb 27, 2019 | Boulder Real Estate, Visiting Boulder
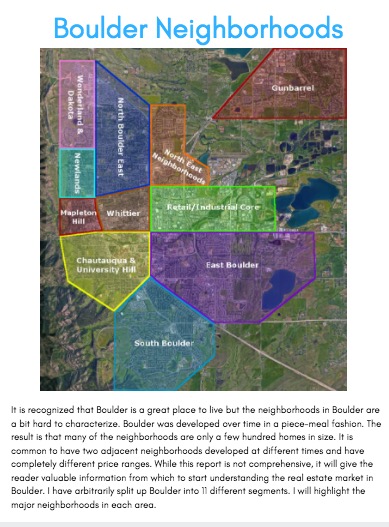
 I realized a few years ago that people coming from out of town were having a hard time making sense of the different neighborhoods within Boulder. In response, I created The Boulder Neighborhood Guide. In this report I have split Boulder into eleven different areas and present the lifestyle highlights, schools, shopping districts, local recreation, basic real estate statistics and a sample of sales from the previous year for each area. If you’re interested in learning more about the different neighborhoods within the City of Boulder this may be helpful.
I have just finished updating The Boulder Neighborhood Guide for 2019 and invite you to view or download it. Here is a PDF copy Boulder Neighborhood Guide 2019
If you are visiting Boulder you may be interested in where to stay, where to eat, things to do and how to get around. You may also be interested in walking some of Boulder’s neighborhoods. I have created a few self-directed walking tours in Boulder that may be fun if you are visiting town. To access all of that information go my “Visiting Boulder Page”
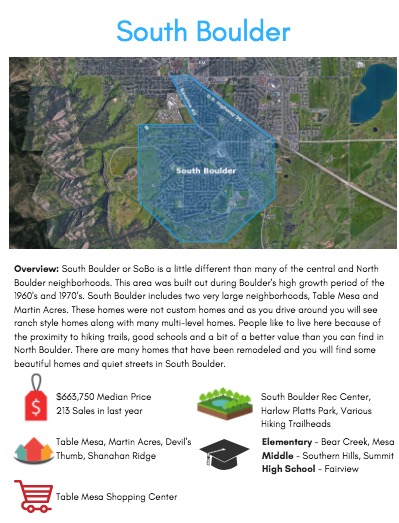
Here are a few example pages from the report:
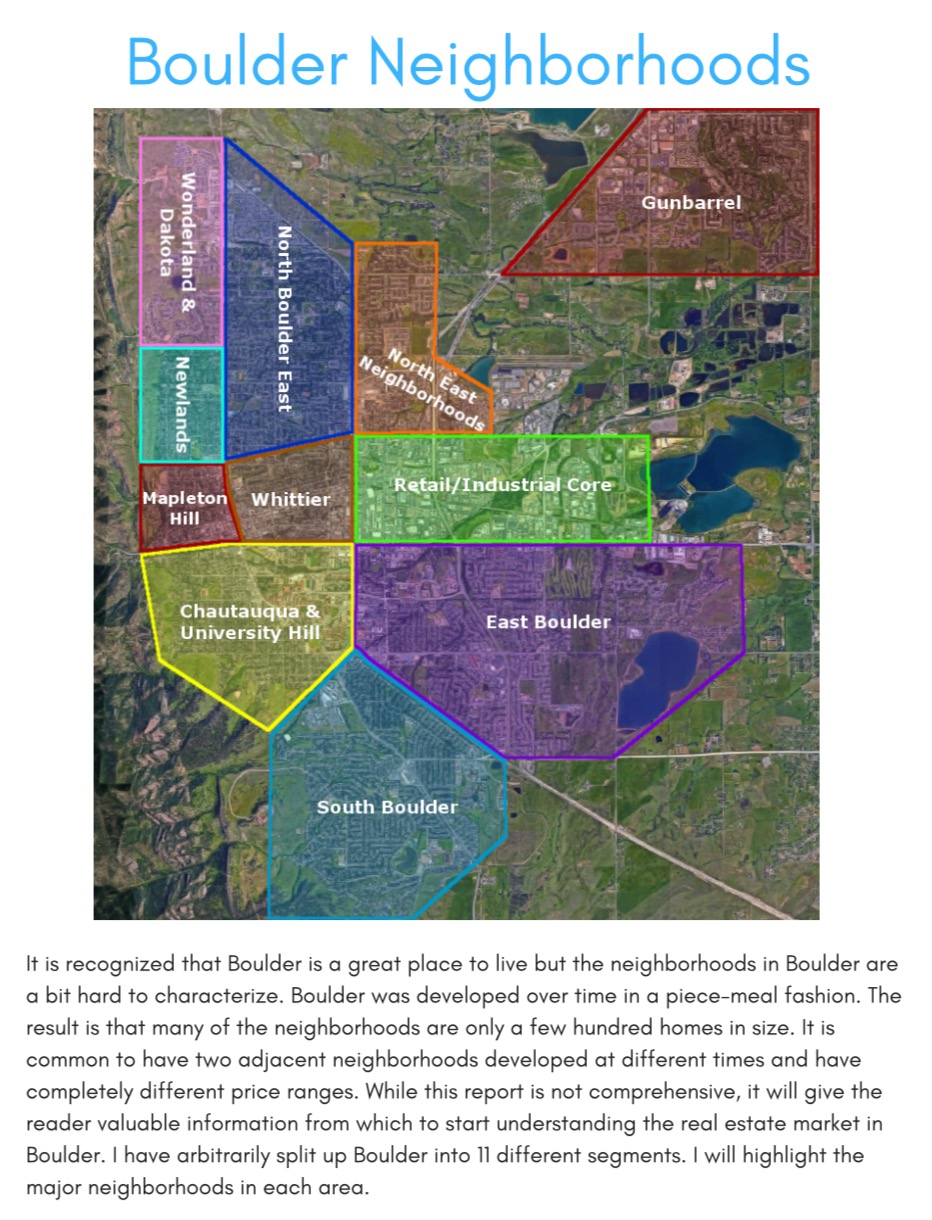
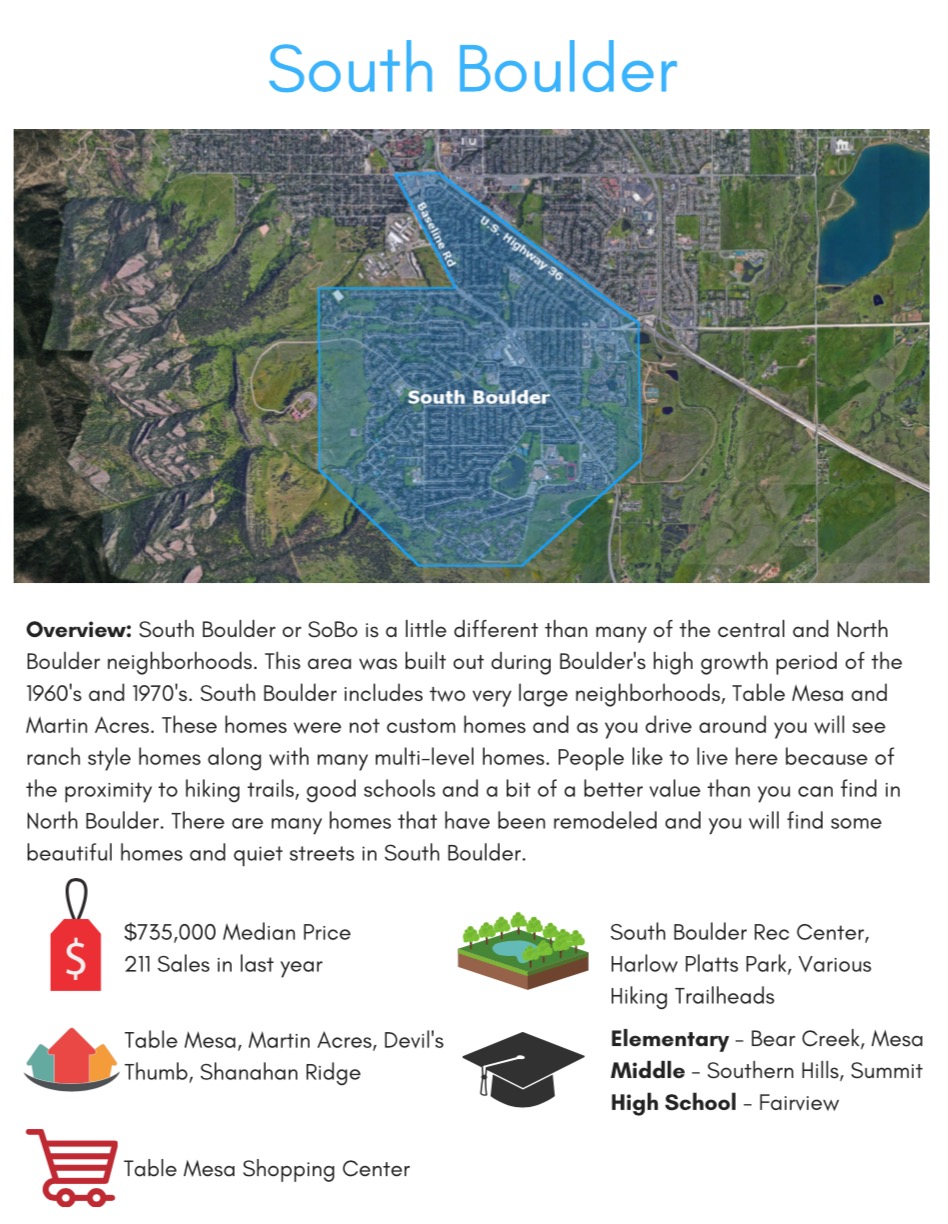
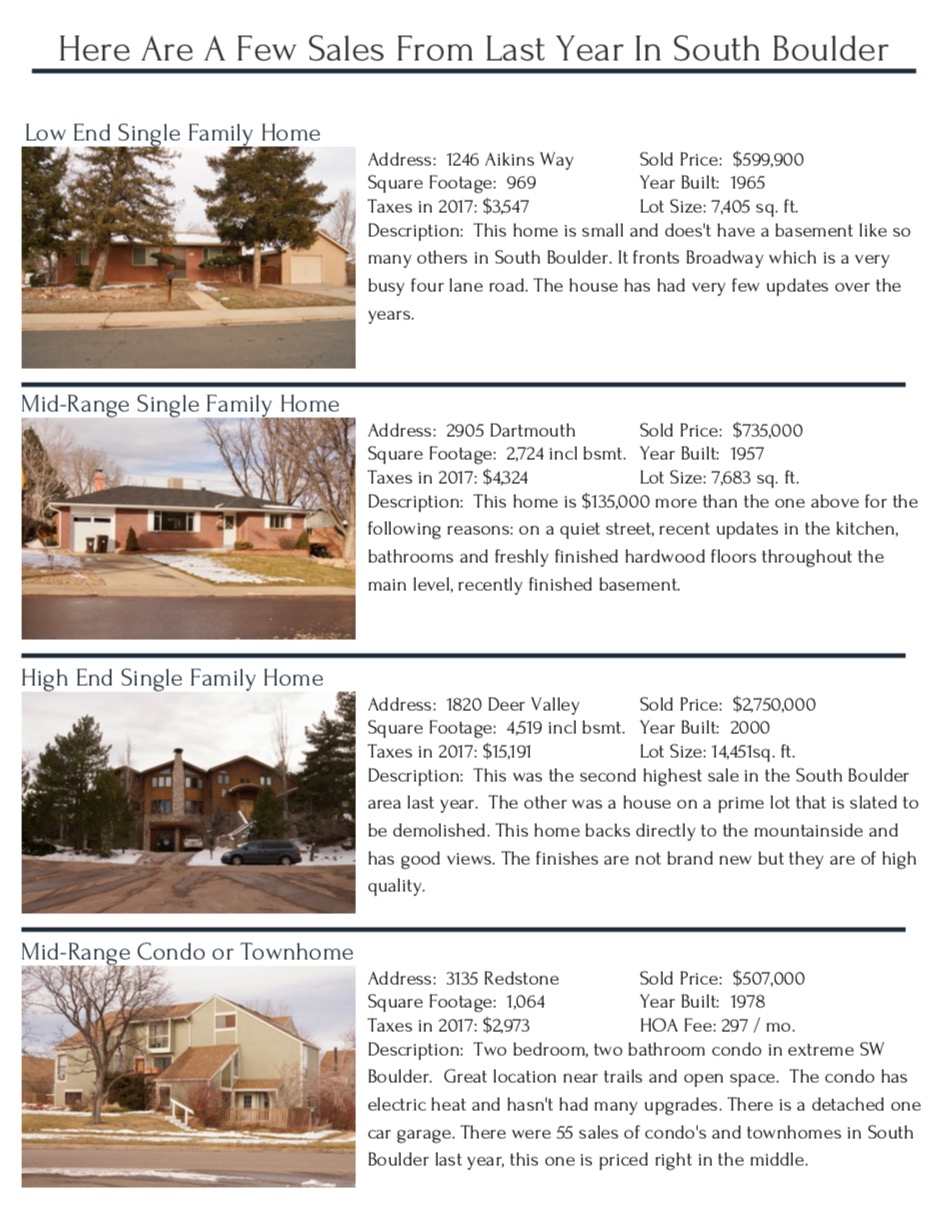
A note about the photography of the listings. In presenting a consistent sample I chose homes in an area that were: at or near the low end of the price range, one at the median price of single family homes and one at the very top of that areas price ranges. For condos and townhomes, I choose one at the median price. I didn’t choose my listings. I also respect the copyright of those photos that are taken by others and found on the MLS and other websites. So I drove around this winter and took photos. Definitely not the typical real estate glamour shot.

by Neil Kearney | Feb 1, 2019 | Boulder County Housing Trends, Statistics
2018 Boulder County Real Estate Market Report Overview 2018 was another strong year for the Boulder area real estate market. During the first half of the year, the combination of low inventory and strong demand extended the “sellers market” that we have been...

by Neil Kearney | Jan 21, 2019 | Boulder County Housing Trends, Statistics
Residential real estate sales were down 18% during December compared to a year ago. This finished up a quarter where sales dropped 12%. After a strong start to the year, sales for 2018 were down 4.7% compared to 2017.
We are moving towards the spring market, which is traditionally our busiest time of year. Sales and activity will increase, it will be interesting to see how much. My expectation is that it will be more of a balanced market rather than a sellers market. However, despite lower sales over the past few months, inventory is still low. Fewer homes to view and consider causes buyers to jump on the new listings that are exceptional. Take a look at the annotated slideshow below to get a better sense of the market.
As always, I’m here to help.

by Neil Kearney | Oct 15, 2018 | Boulder County Housing Trends, Statistics
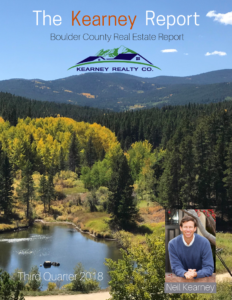
Boulder County Real Estate Market Report
Click link below to view and download the PDF:
The Kearney Report 3rd 2018
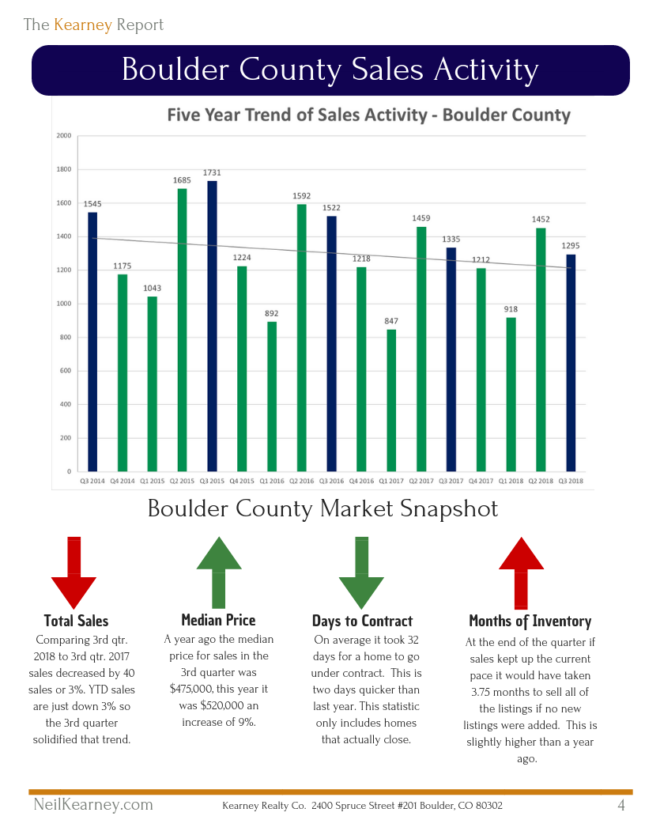
The real estate market in Boulder County continued to be strong and steady. Technically, it is still a seller’s market, but currently we are seeing some momentum towards a balanced market in some price ranges. Low inventory continues to be a key factor in the market; giving fewer choices to buyers and helping fuel continued appreciation for sellers. Sales during the quarter were down 3% compared to the same quarter last year. This is in-line with the year-to-date numbers which also show a 3% drop from a year ago. Median prices continue their upward climb with prices approximately 9% higher than they were a year ago.
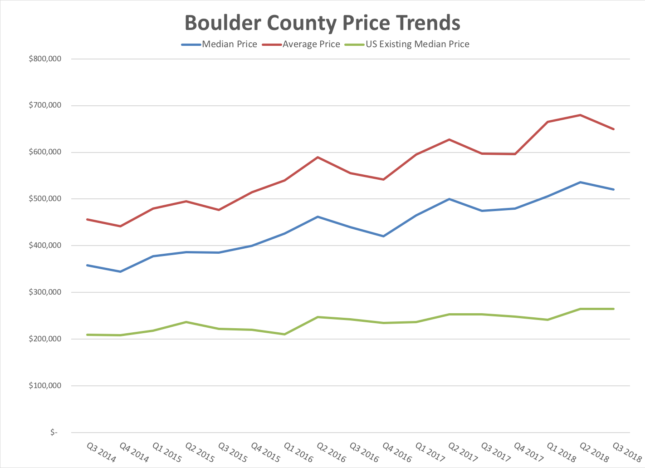
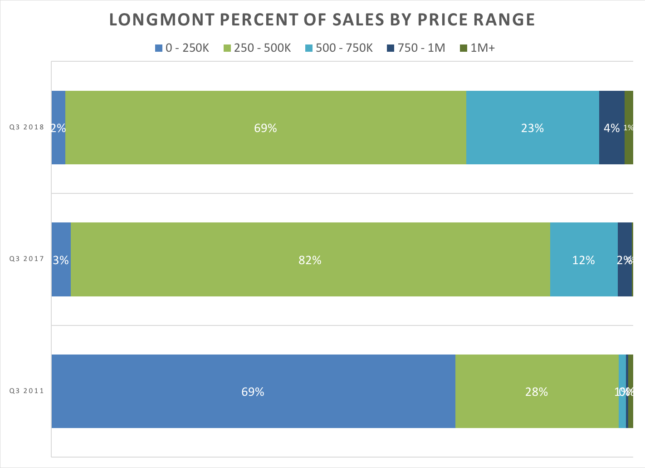
The Kearney Report analyzes the market on a county wide basis as well as smaller segments including, City of Boulder, East County (Erie, Lafayette, Louisville, Superior) and Longmont. With 15%, Longmont has seen the most appreciation over the past year. As you look through the report, keep your eye out for the bar graph that shows “Sales by Price Range” for each community. The inclusion of 2011 as a comparative year in this graph gives a strong visual representation of how the sub $250,000 market has all but disappeared. Most startling is in Longmont, where in 2011 69% of the sales were for $250,000 or less. This year just 2% sold in this price range! Many families are being priced out of the market. Especially as interest rates rise.
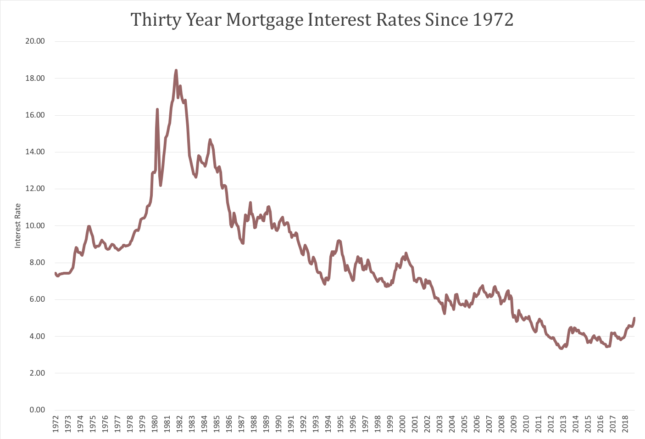
Speaking of rising interest rates, according to FreddieMac, the average 30 year mortgage rate in January was just above 4%. After a recent bump in early October, buyers are now seeing 5% and above for the first time in more than half a decade. Consumer confidence is at a 20 year high but home affordability is dropping. It will be interesting to see if buyer demand will be resilient in the face of higher interest rates.
How the market is performing has much to do with location and price range. Homes that are priced below the median in each of our sub-markets are still moving quickly. The higher priced homes and especially the luxury market are experiencing slower demand. Currently, in the City of Boulder, homes listed over $2 million have 9.5 months of inventory on the market and those under $1 million have 3.1 months of inventory.
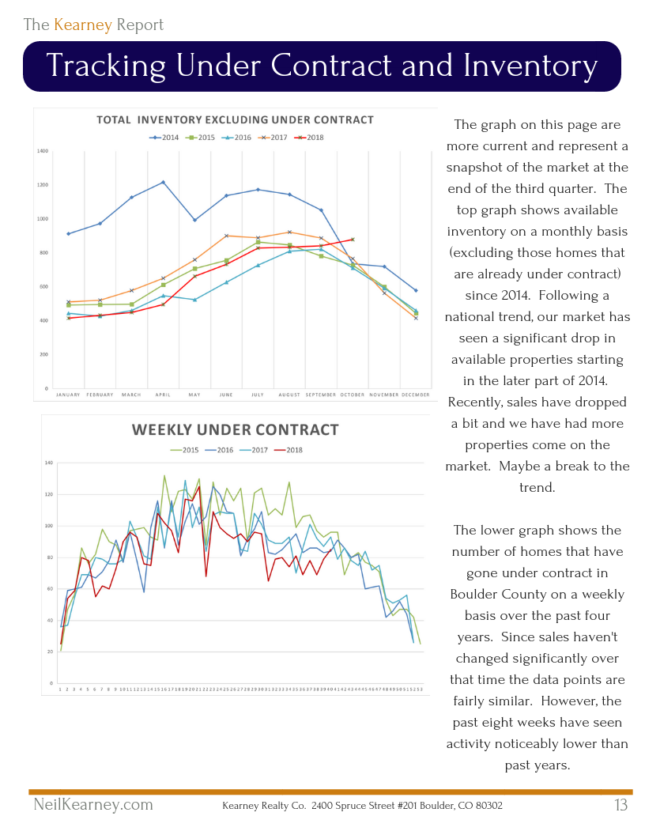
The most recent statistics confirm my feel that the market is slowing. Certainly, some of that is seasonal, but in a few ways it feels different than the past few years. Inventory is rising just a bit, the percentage of homes that are under contract has fallen to a four year low (37%), and fewer homes are going under contract on a weekly basis over the past two months. That said, I’m still taking calls all the time from people who want to move to Boulder and are determined to make it happen. Any shift we are seeing in the market is slight, and only time will tell.
Here are a few sample pages from this quarter’s report:
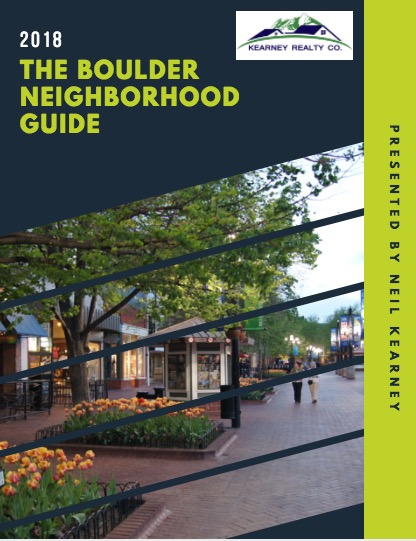
by Neil Kearney | Mar 12, 2018 | Boulder County Housing Trends, Boulder Real Estate
Boulder Neighborhood Guide
 I realized a few years ago that people coming from out of town were having a hard time characterizing the different neighborhoods within Boulder. In response I created The Boulder Neighborhood Guide. In this report I have split Boulder into eleven different areas and present the lifestyle highlights, schools, shopping districts, local recreation and basic real estate statistics for each area. If you’re interested in learning more about the different neighborhoods within the City of Boulder this may be helpful.
I have just finished updating The Boulder Neighborhood Guide for 2018 and invite you to view or download it. Here is a PDF copy Boulder Neighborhood Guide 2018
If you are visiting Boulder you may be interested in where to stay, where to eat, things to do and how to get around. You may also be interested in walking some of Boulder’s neighborhoods. I have created a few self-directed walking tours in Boulder that may be fun if you are visiting town. To access all of that information go my “Visiting Boulder Page”