
by Neil Kearney | Aug 6, 2020 | Boulder County Housing Trends, Statistics
 Click here to view and download the entire report
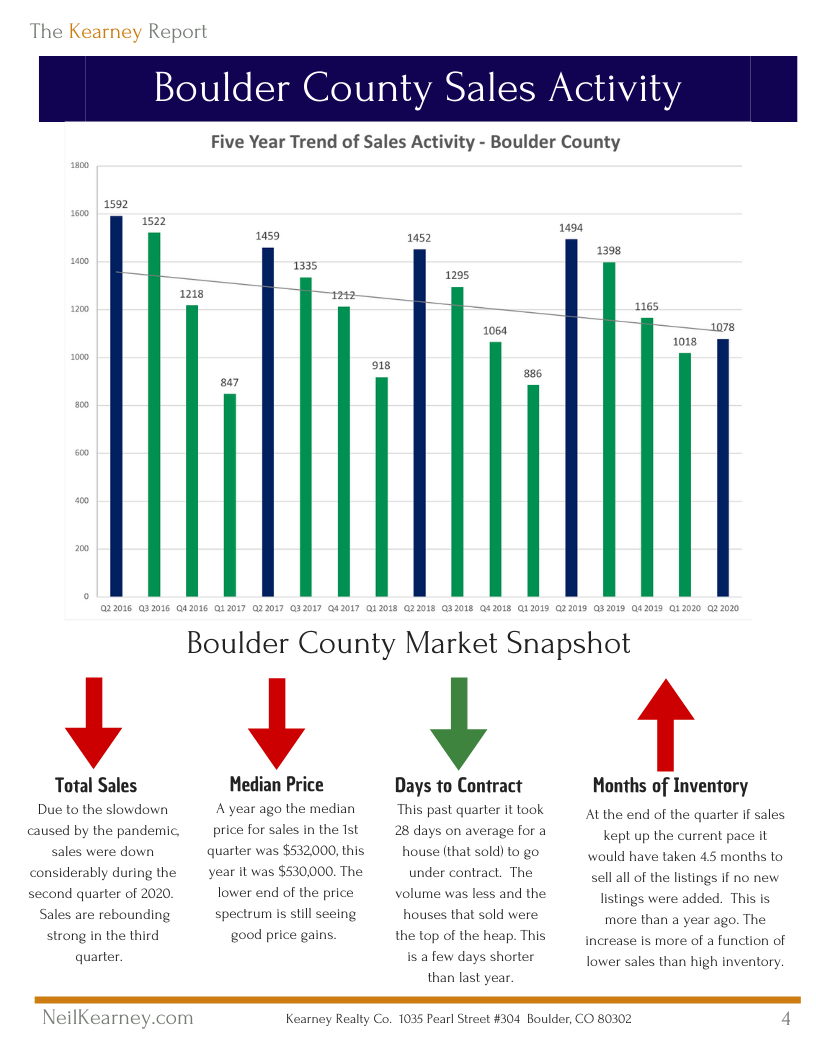
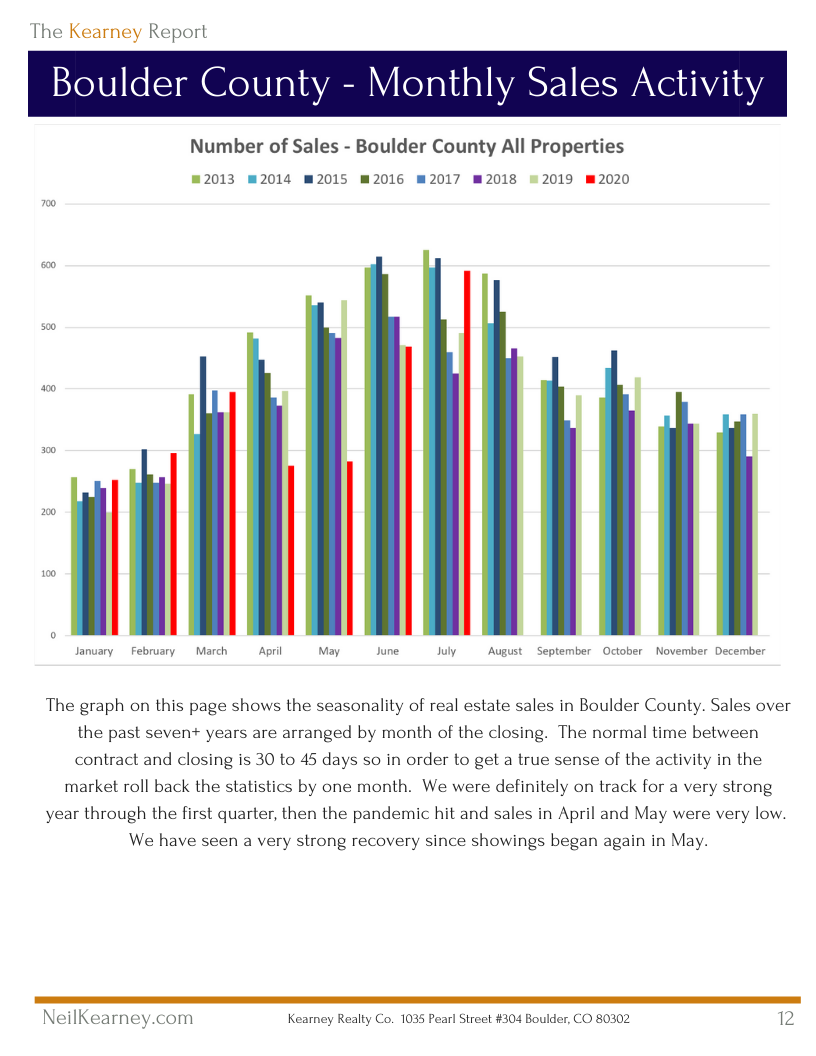
We have all been on a wild ride this year! As we started 2020 none of us could have predicted how flexible we would need to be as the world has changed around us. Face coverings, social distancing, Zoom meetings, cancellations, working from home,… these have all become a part of our year. We have seen some businesses adjust and thrive, and others close for good. We have seen the stock market tank and then rebound. Unemployment climb to record high levels and interest rates fall to all time lows. Real estate sales have been on a big pendulum as well. Low sales in April and May reflected the stay-at-home orders announced in March but have rebounded strongly this summer.
Everyone needs a place to live, and when we are forced to stay in our house for weeks on end it leads to decisions stemmed from change. Change is what drives the real estate market. As younger home buyers take advantage of low interest rates, we have seen especially strong sales of the lower priced homes in our market. It’s taking a bit longer for the sales to trickle all of the way up to the luxury market, but it is happening. One thing we are seeing, is people being drawn to our beautiful and less crowded area from the big cities. Some who have the financial means to move away from the big city are looking into a change of lifestyle . A few weeks ago I got back to back calls from potential buyers from Miami who inquired about land in our area. This could be a trend that fuels our market into the future.
This is a strange year for statistics. Of course sales were down for the second quarter. We were all staying at home and taking family walks for two months instead of looking at real estate. But the graphs seen in this report do show that we had a very strong start to the year and have had a very strong rebound. The first part of the rebound was made up of buyers and sellers who were planning to buy or sell just as the pandemic hit. After all, March, April and May are our busiest months of the year. Those transactions were pushed back a few months. Now we are seeing another wave of activity fueled by low interest rates, a recovery in the stock market and people feeling more stable in their jobs. With those foundation points in place, people are able to dream of a different place to live that fits their needs better than where they are now.
Obviously it’s not a clear path ahead. This is an election year (different than any I have been a part of) and we are still trying to balance getting back to work and keeping our population safe. How this will affect small business, higher education (a big deal in our community), and commercial real estate are just three of the upcoming unknowns that may have large repercussions. We will all need to be flexible as we make plans based on past assumptions that may not hold into the future.
Homes continue of sell and as always I’m actively helping buyers and sellers successfully close transactions. I’m always here for you to be of service. Enjoy the report and stay in touch!
The Kearney Report 2nd Quarter 2020 (1)

by Neil Kearney | Apr 16, 2020 | Boulder County Housing Trends, Statistics
In Boulder we are having a late season snow day. We are working our way up to a foot of fresh, wet spring snow. Today is a nice day to be at home. I started these weekly updates roughly a month ago, just after the ‘stay at home’ orders were made in...
by Neil Kearney | Mar 23, 2020
Boulder Neighborhood Guide It is widely recognized that Boulder is a great place to live, but the neighborhoods in Boulder are a bit hard to characterize. Like many towns, Boulder was developed over time in a piece-meal fashion. The result is that many of the...
by Neil Kearney | Feb 5, 2020 | Boulder County Housing Trends, Statistics
Boulder County Real Estate Market Update – 2019 Year-In-Review
2019 was another good year for the Boulder area real estate market. After, more than six years of high growth appreciation (more than 72% in the past 8 years!) we saw modest price appreciation over the entire market area.In general,I would characterize the market as being more balanced during 2019. Sellers with updated homes and realistic listing prices were able to sell fairly quickly and for close to (or slightly above) asking price. Buyers showed restraint and patience. Only acting quickly on homes that met all of their needs and were also priced well. This left homes that were dated or overpriced sitting on the market for extended periods.
Although sales actually increased for the year, there seemed to be less demand (as evidenced by showings and multiple offer situations) for any individual home. Inventory of available homes was higher in 2019 than at any time since 2014. Understanding that they had choices gave buyers space to compare and think about homes. Where in recent years, buyers soon found out that “thinking about it” meant missing out. This psychological change in buyer dynamics had much to do with the overall change that we felt in the market.
Here are some of the key statistics for Boulder County real estate in 2019:
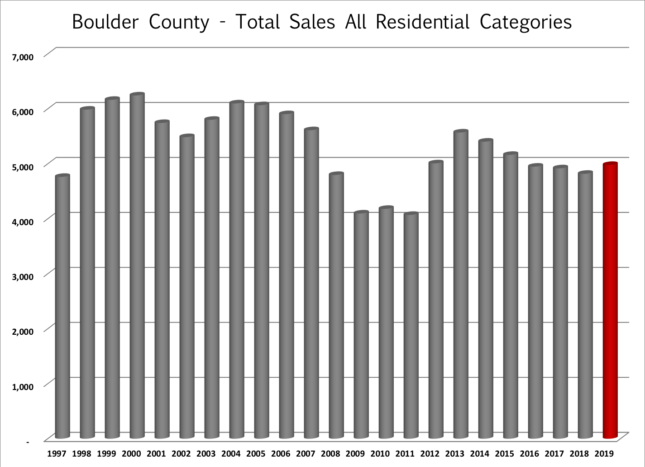 • Total sales increased by 3.3% to 4,979 sales. Despite the increase sales were still 10% lower than 2013 levels.
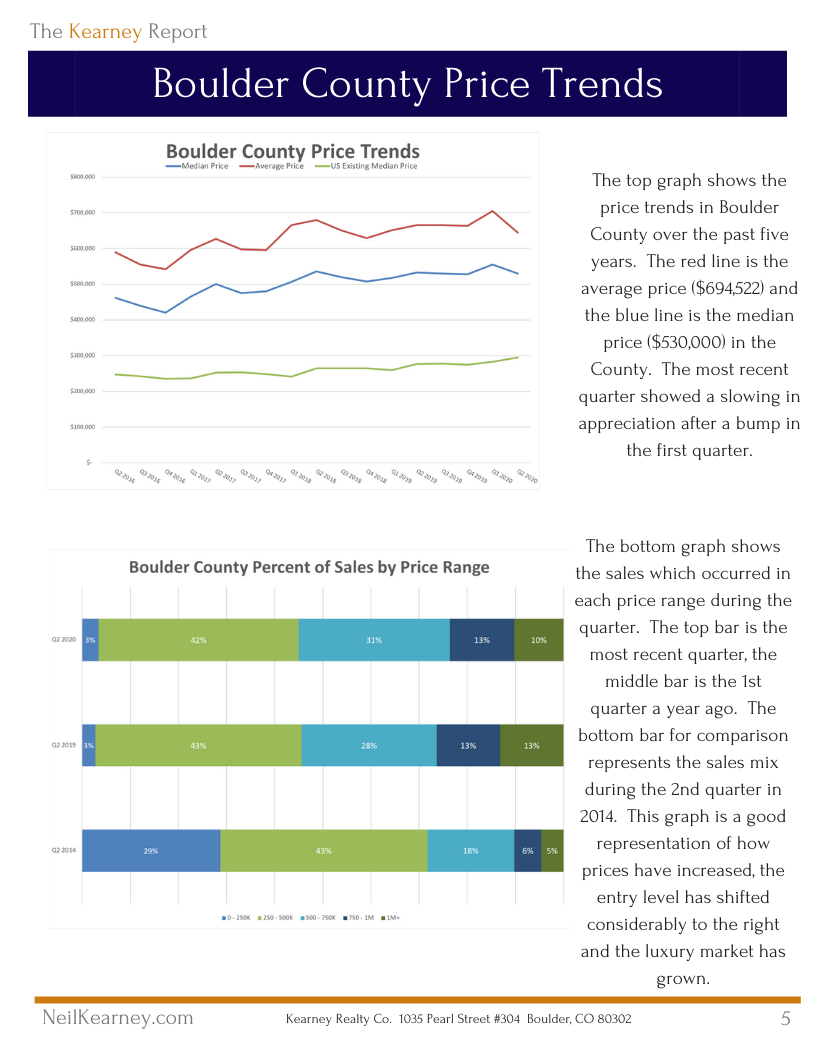
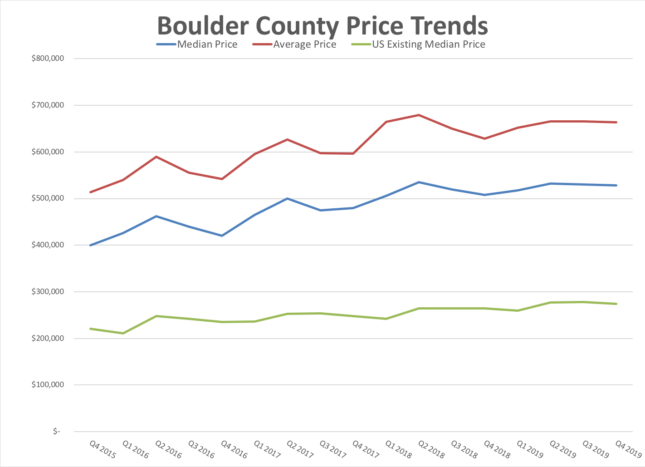 • Slower Price Appreciation – The median price for all sales in 2019 was $530,000 which is up approximately 3%.
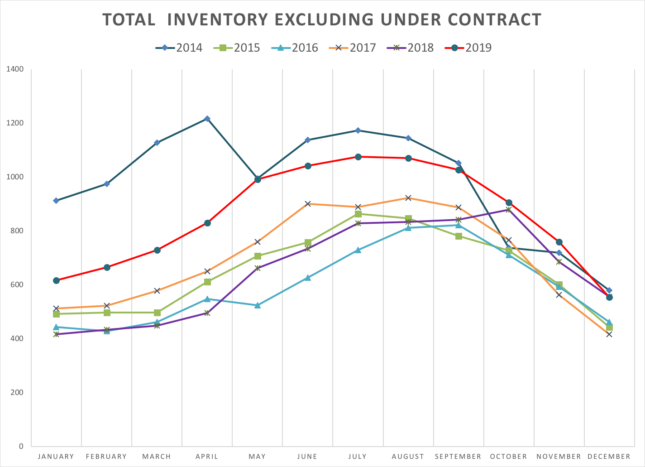 • Higher Inventory, But Still Lower than Historical Average – At the end of December there were just 899 properties on the market in Boulder County and 344 of those were already under contract.This is more than we had on the market a year ago, but much lower than historical averages.
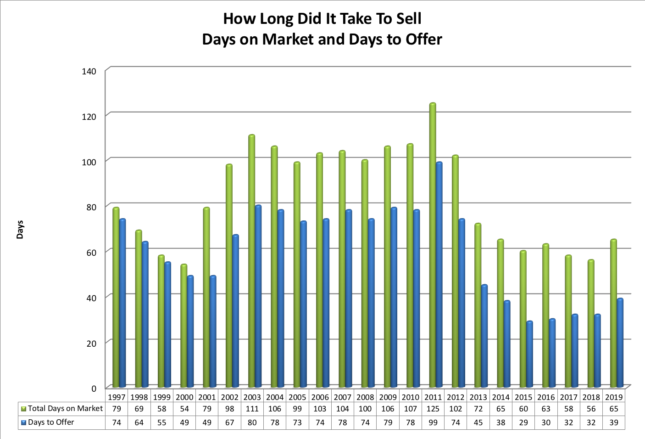 • Longer Time to Sell – Average days to offer was 39 (Higher than last four years and similar to 2014)
• Slightly More Negotiation – Average negotiation off of list price 1.2% (last year was slightly lower at 1.14%)
• Fewer multiple offer situations – 21% of properties sold for a price above the list price (last year was 32%). The average premium paid for these sales was 2.5% (last year the average premium when paid was 3.3%)
• Offers below listing price was the norm – 55% of properties sold for a price below list price (2018 = 45%). The average discount on these sales was 3.1% (2018 = 3.2%).
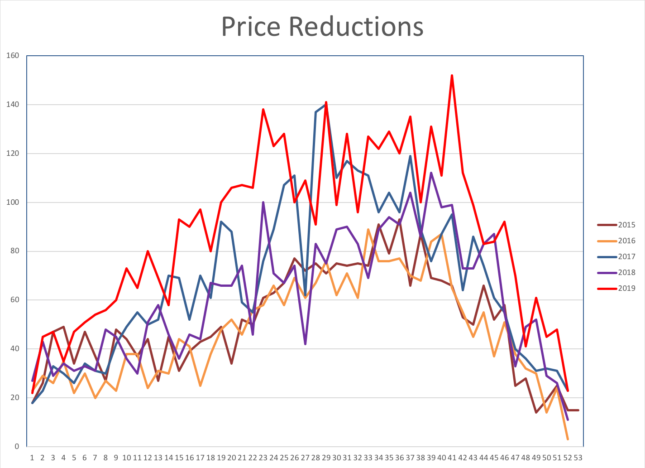 • More Price Reductions – We saw more price reductions by Seller’s this past year than in any recent year.
What’s In Store for 2020 and Beyond?
In the Kearney Report for the 3rd quarter of 2019, it was shown that we are no longer in the expansion phase of the real estate cycle.Locally we seem to be in the “hyper supply” phase which is characterized by increases in inventory, new construction catching up to the market, purchase prices appreciating a lower rate, and increase in interest rates.All of these seem to be tracking as expected except increasing interest rates.Barring a large external event which negatively affects the economy, I expect that our current market conditions will continue for a few more years.Sales will continue at similar levels, prices appreciation will be positive, but less than 4% and Buyers will continue to gain power in negotiations.No big changes just a gradual move around the real estate cycle.
Quarterly Trends
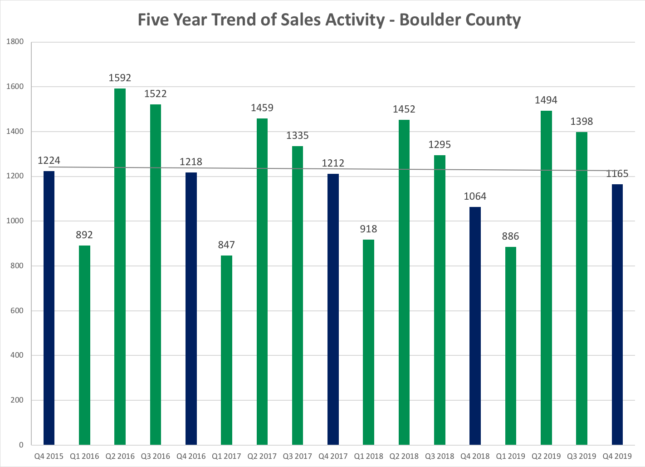
- Sales for the fourth quarter increased by 101 properties. The five-year trend is flat.
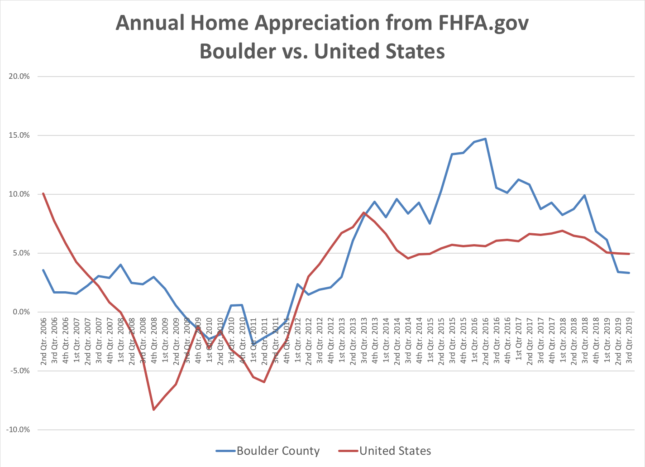
- The graph below shows the average annual price appreciation for both Boulder County (blue line) and the United States (red line) since the second quarter of 2006. Each data point shows one year of appreciation on a quarterly basis. The most recent quarter shows Boulder’s four-quarter appreciation was 3.32% which ranked it 185th out of 231 areas in the study. The average home appreciation in the US over the past year was 4.94%. Boulder County’s appreciation had outpaced the nation’s average since the third quarter of 2013. This trend ended during the second quarter of 2019. Over the past five years our cumulative appreciation was 53.25%, while the nationwide average was 32.93%.
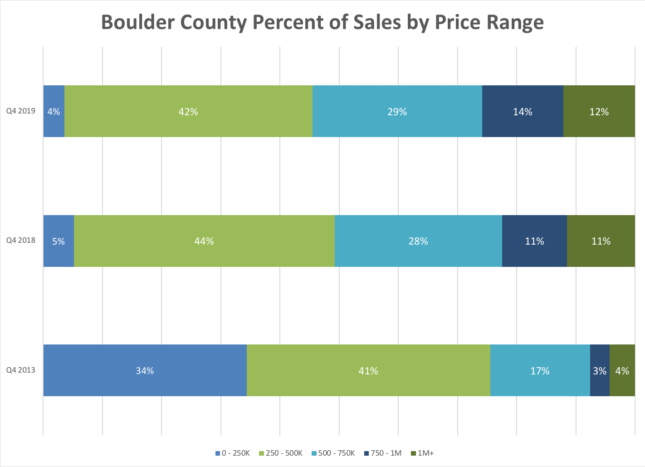
- In Boulder County during the 4th quarter just 4% of all sales were for $250,000 or less. Compare this to five years ago when 34% of sales were for less than $250,000. During the most recent quarter 26% of sales were for $750,000 and above. Five years ago it was 7%.

by Neil Kearney | Aug 23, 2019 | General Real Estate Advice, Real Estate 101
 Millions of dollars are being poured into the real estate industry through venture capital and much of that money is going into a segment called “iBuying”. IBuying is when a consumer sells their home to a corporation whose business it is to purchase homes using a streamlined process for a price derived by an algorithm, The sales transactions are cash purchases and can be completed quickly. In this article I will provide a high level overview of what it is, who is involved, the nuts and bolts of the process and the pros and cons of working with an iBuyer.
The concept isn’t new. We have seen homemade signs tacked to power poles and post cards offering to buy your “ugly house” for decades. The idea has always been to provide convenience to a small segment of the market who values the idea of selling their house quickly over getting every dollar out of the house. The logistics of how to get to your next house while dealing with the unknowns (time, price) of selling your current home are often a huge factor in the reason why people decide to stay put. Providing a method that simplifies that puzzle is a much needed service. But are the associated costs worth it?
The main entrants into the iBuying space are public companies (Zillow), venture capital backed startups (Opendoor, OfferPad, Knock), and brokerages like Keller Williams and Redfin. For these companies there are three possible revenue streams: 1) The return on buying a property for a discount and then selling it (sometimes at a much later date after renting it out or renovating it) for a higher price. 2) Fees collected as part of the transaction. These fees can run up to 10%. 3) The value of the name of the potential sellers who turn down the offer. Let me explain a bit more about each of these.
- Each company will generate an offer priced based on available data fed into their proprietary data stream. I can imagine that the algorithms include recent sales, forward looking market trends, assessor data, neighborhood statistics and more. After asking for an offer, the seller can expect an offer within 24 hours. There is no opportunity for negotiation. The price offered includes a discount for the liquidity provided and the risks to the company that include; condition risk and market risk (this hasn’t been tested in a stagnant or falling market). The price offered, while competitive is less than what the algorithm thinks that the house is worth. They are after all looking for positive investment returns and providing a convenience for the seller. They hope to buy as low as they can and sell later for a positive return.
- On top of the lower than market price there are fees associated with selling to an iBuyer. Reportedly these range between 7% and 10% of the agreed upon price.
- One figure I saw while researching this article said that as many as 90% of sellers turns down the offer. In today’s economy good data is money and qualified leads are money. These companies including Zillow realize that brokerages and individual agents will pay good money for a stream of seller prospects who have indicated that they are ready to sell. Like relocation companies who fund their services by charging hefty referral fees to Realtors, this data source will be an increasing source of revenue for the companies involved.
After requesting an offer from an iBuyer you can expect to receive a price within one day. If you accept the price and associated transaction costs in the offer you can then expect an inspector to visit your home to see if there are any repairs needed. If there are any repairs needed you can expect that the offer price to be adjusted to reflect the work needed. If the transaction proceeds past this stage you can expect to close as quickly as you need to.
Pros
Here are some of the reasons a seller may choose to work with an iBuyer.
- Fast closing schedule.
- Fewer unknowns, knowledge of what you are going to get up front.
- No showings. No prepping the house for showings.
Cons
Here are some of the reasons that a seller may choose not to work with an iBuyer.
- Not maximizing the sales price. Lower price given for a quick guaranteed offer. Just one offer, no supply and demand factors at work.
- Costs are typically 7-10% of the agreed upon purchase price. This is more than a typical commission.
- Not available for every home or in every market. Currently iBuyers are expanding quickly but are only available in 20 markets. They are not typically interested in luxury homes or higher price ranges.
In summary, iBuyers are expanding. It provides the seller with the peace of mind and convenience of a guaranteed offer and a flexible closing date. However, that convenience comes with a hefty price tag. It’s not for everyone but for those in a pinch it might be a good option. If you are considering working with an iBuyer it would be prudent to call a Realtor as well to get an opinion of price and an estimate of net proceeds after expenses. That way you will have the information you need to properly weigh your decision. Let me know if I can help in this manner.


