
Boulder County Real Estate Market Update – 2019 Year-In-Review
Click Here To Download and View The Entire Report
2019 was another good year for the Boulder area real estate market. After, more than six years of high growth appreciation (more than 72% in the past 8 years!) we saw modest price appreciation over the entire market area.In general,I would characterize the market as being more balanced during 2019. Sellers with updated homes and realistic listing prices were able to sell fairly quickly and for close to (or slightly above) asking price. Buyers showed restraint and patience. Only acting quickly on homes that met all of their needs and were also priced well. This left homes that were dated or overpriced sitting on the market for extended periods.
Although sales actually increased for the year, there seemed to be less demand (as evidenced by showings and multiple offer situations) for any individual home. Inventory of available homes was higher in 2019 than at any time since 2014. Understanding that they had choices gave buyers space to compare and think about homes. Where in recent years, buyers soon found out that “thinking about it” meant missing out. This psychological change in buyer dynamics had much to do with the overall change that we felt in the market.
Here are some of the key statistics for Boulder County real estate in 2019:
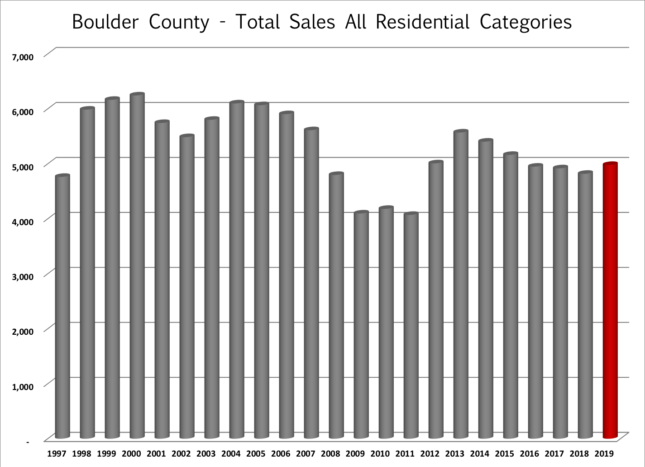 • Total sales increased by 3.3% to 4,979 sales. Despite the increase sales were still 10% lower than 2013 levels.
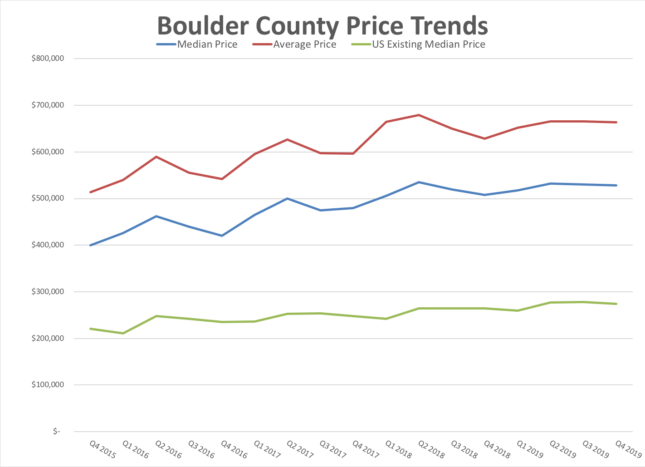 • Slower Price Appreciation – The median price for all sales in 2019 was $530,000 which is up approximately 3%.
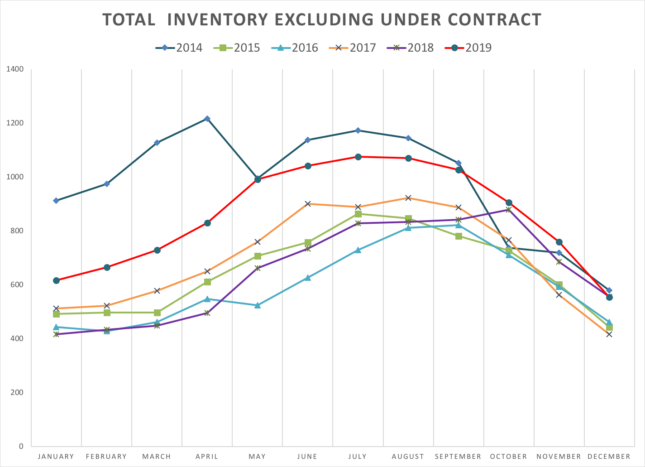 • Higher Inventory, But Still Lower than Historical Average – At the end of December there were just 899 properties on the market in Boulder County and 344 of those were already under contract.This is more than we had on the market a year ago, but much lower than historical averages.
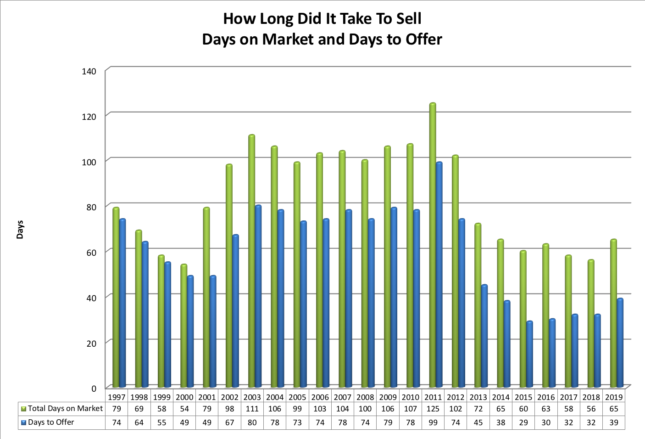 • Longer Time to Sell – Average days to offer was 39 (Higher than last four years and similar to 2014)
• Slightly More Negotiation – Average negotiation off of list price 1.2% (last year was slightly lower at 1.14%)
• Fewer multiple offer situations – 21% of properties sold for a price above the list price (last year was 32%). The average premium paid for these sales was 2.5% (last year the average premium when paid was 3.3%)
• Offers below listing price was the norm – 55% of properties sold for a price below list price (2018 = 45%). The average discount on these sales was 3.1% (2018 = 3.2%).
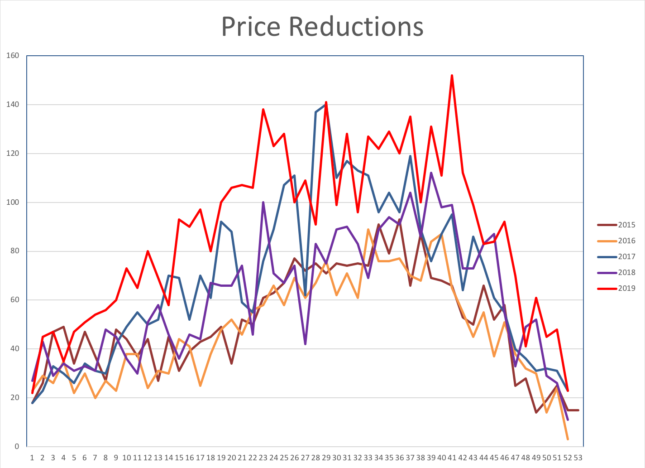 • More Price Reductions – We saw more price reductions by Seller’s this past year than in any recent year.
What’s In Store for 2020 and Beyond?
In the Kearney Report for the 3rd quarter of 2019, it was shown that we are no longer in the expansion phase of the real estate cycle.Locally we seem to be in the “hyper supply” phase which is characterized by increases in inventory, new construction catching up to the market, purchase prices appreciating a lower rate, and increase in interest rates.All of these seem to be tracking as expected except increasing interest rates.Barring a large external event which negatively affects the economy, I expect that our current market conditions will continue for a few more years.Sales will continue at similar levels, prices appreciation will be positive, but less than 4% and Buyers will continue to gain power in negotiations.No big changes just a gradual move around the real estate cycle.
Quarterly Trends
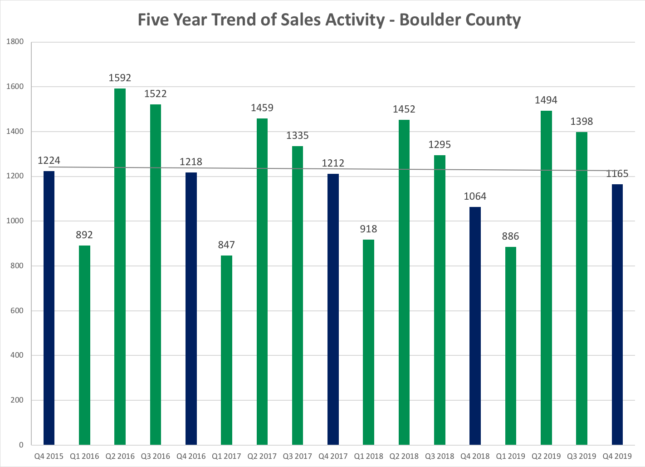
- Sales for the fourth quarter increased by 101 properties. The five-year trend is flat.
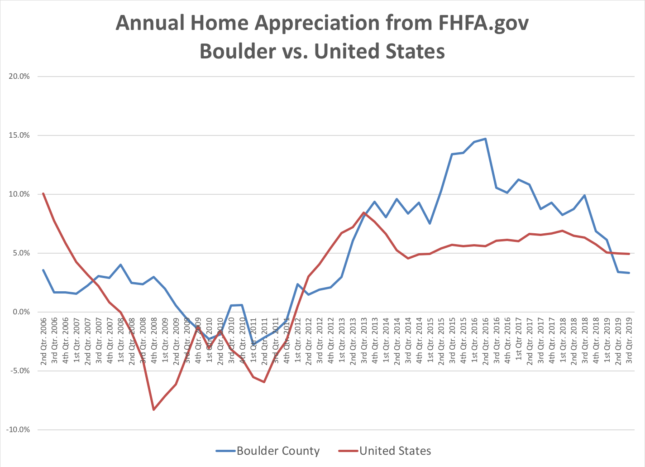
- The graph below shows the average annual price appreciation for both Boulder County (blue line) and the United States (red line) since the second quarter of 2006. Each data point shows one year of appreciation on a quarterly basis. The most recent quarter shows Boulder’s four-quarter appreciation was 3.32% which ranked it 185th out of 231 areas in the study. The average home appreciation in the US over the past year was 4.94%. Boulder County’s appreciation had outpaced the nation’s average since the third quarter of 2013. This trend ended during the second quarter of 2019. Over the past five years our cumulative appreciation was 53.25%, while the nationwide average was 32.93%.
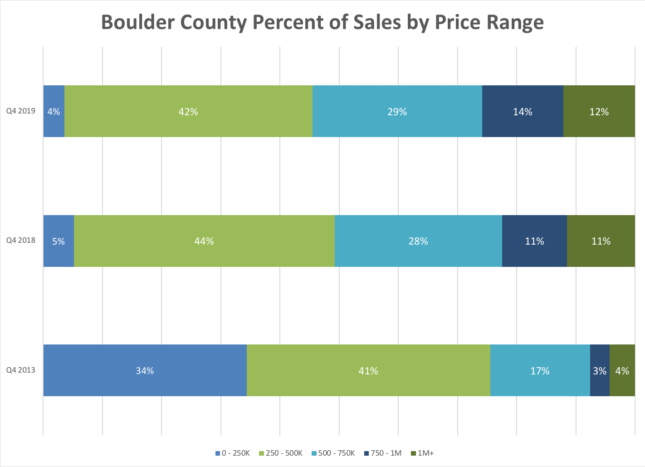
- In Boulder County during the 4th quarter just 4% of all sales were for $250,000 or less. Compare this to five years ago when 34% of sales were for less than $250,000. During the most recent quarter 26% of sales were for $750,000 and above. Five years ago it was 7%.

