Boulder County Real Estate Statistics October 2015

Boulder County Real Estate Statistics October 2015

The real estate market in Boulder County remained strong in October. During the month, sales were up 6.5% from a year ago and up 40% from 2010. For the year so far sales are up 7% from a year ago and up 29% from 2011 which was the trough over the past ten years.  We are back up to sales levels similar to 2007.

The inventory continues to be very low. At the end of October there were 1,063 active and pending homes on the market. This is half of what was available at the same time in 2007.  There are currently 620 single family homes on the market in Boulder County that don’t already have a contract. Back in 2007 there were 1,919 at the end of October. Slim pickings! Enjoy the slideshow below which shows the trends in sales, inventory and pending contracts over the last five years.


Boulder County Real Estate Statistics – September 2015

Boulder County Real Estate Statistics – September 2015

Residential real estate sales were up 9% during September and are up 8% for the year-to-date. Activity in the market continues to be very strong. At the end of September 44% of active listings were already under contract. Inventory of available homes is still very low. At the end of the month there were just 782 properties that were on the market and available for an offer. This represents an inventory of just 1.6 months.  In other words, if we were to freeze any new listings from coming on the market, it would take 50 days to sell all of the homes that are currently available.  Please take a look at the slideshow below for more detailed information.

Number of Sales in September

Sales Last September

%

Increase of

Average Price For Sales In September

Average Price Last September

%

Increase of

Boulder County Luxury Home Market Update

Boulder County Luxury Home Market Update

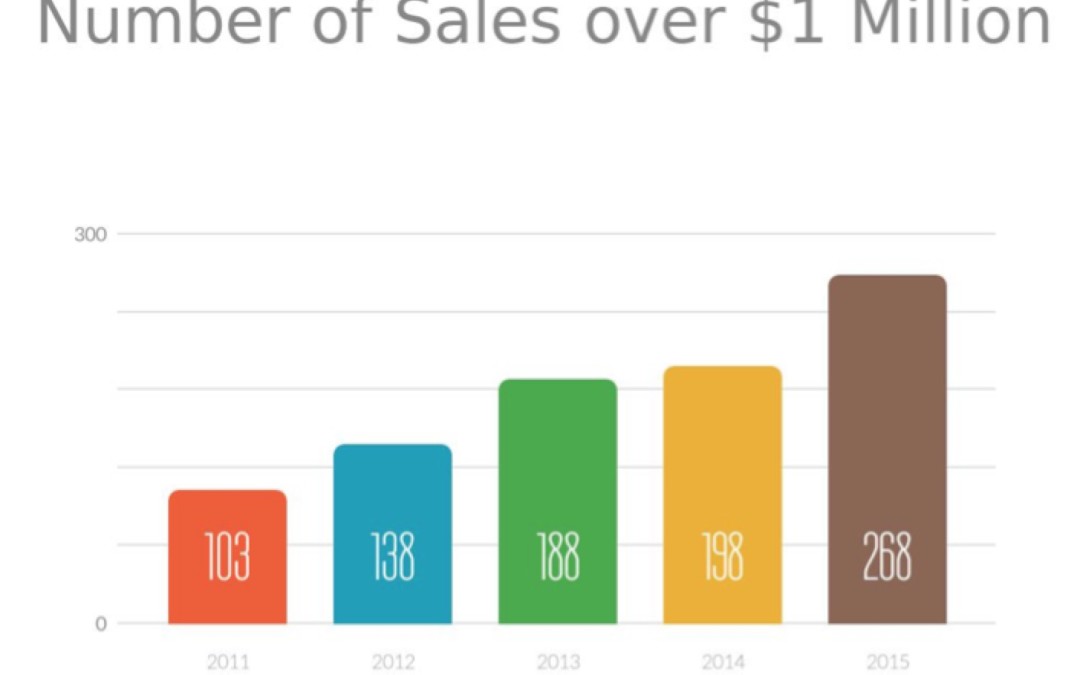
Sales of homes over $1 million are at a record pace in Boulder County. So far this year there have been 268 sales in Boulder County that exceed $1 million. This is up from 198 a year ago and just 103 from five years ago. Prices are also holding closer to asking price. This year the average negotiation off of list price is around 4%. In 2011 it was around 8%.

The strength in this market is however tempered a bit when comparing it to the market in general.  46% of homes that are priced between $500,000 and $1 million are under contract in Boulder County; 19% for homes between $1 and $1.5 million; 15% for those homes between $1.5 and $2 million and just 8% of homes listed above $2 million are under contract.

Once you know the sales rate and the number of homes on the market you can figure out the absorption rate. The absorption rate is a fancy way to say how long it would take to sell all of the homes on the market if no new listings were to come on the market.  It would take approximately 2 months to sell all of the listings in Boulder County priced from $500,000 and $1 million and over 19 months to sell all of the listings priced above $2 million.  For all of the details and more interesting facts about the luxury home market in Boulder County please view the slideshow below.

Boulder County Real Estate Statistics – August 2015

Boulder County Real Estate Statistics – August 2015

The real estate market in Boulder County is still especially strong. We are still seeing multiple offers and offers above list price. Sales year-to-date are up 7.4% from last year and sales in August were up over 13% from last year. Prices are up approximately 10% from a year ago.  The slide deck below shows broader trends over the past five years.


Boulder Home Appreciation Top 15 in the Nation

Boulder Home Appreciation Top 15 in the Nation

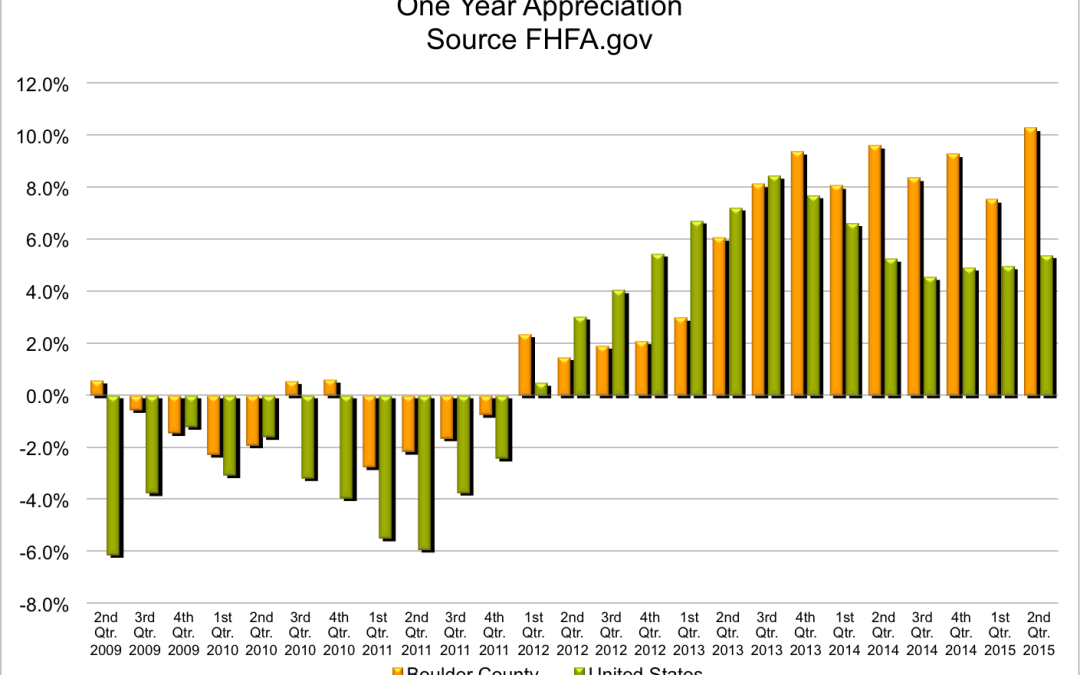
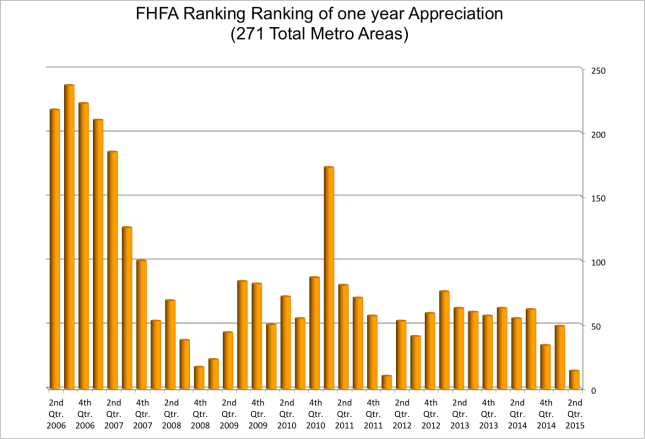
FHFA.gov recently released their report on home appreciation for the period ending June 30, 2015. In the report it shows that Boulder home appreciation is the 14th highest  for the year among the 271 largest metropolitan areas it tracks. Boulder had a 10.27% appreciation for the one year period and 5.30% for the second quarter alone. The quarterly appreciation for our area ranks 5th in the nation and one of the areas ahead of us was Denver.  We know we had a great year and a big spring but this validates the fact that ours is one of the hottest and most active in the nation.

The United States average for the one year period was 5.39%. The top state for appreciation is Colorado with 10.62%.

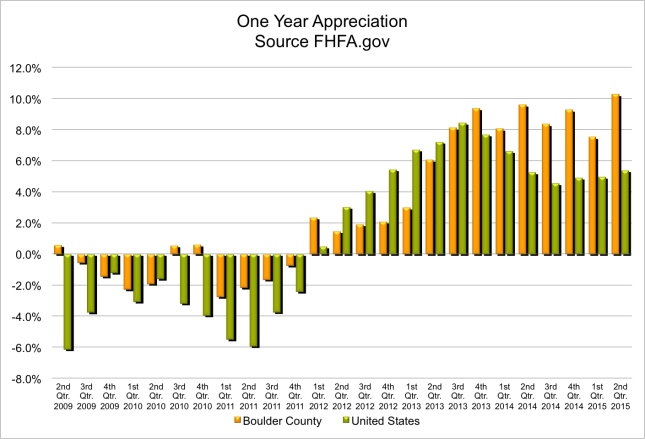
Here are a few charts that represent this data visually. The first one shows Boulder’s appreciation compared to that of the U.S. and the second one shows Boulder’s appreciation national ranking over time. This is the most active market we have had in terms of appreciation since 1999 when we were ranked #1 in the nation.  Stay tuned, we might just gain ground this next quarter.

FHFA comparison

ranking


Boulder County Real Estate Statistics – June 2015

Boulder County Real Estate Statistics – June 2015

June was a strong month in the Boulder area real estate market. Sales were up 14% from May and up 2.2% from last June. Total sales of residential homes and condos are up 7% so far this year.

Inventory is creeping up slowly but it is still well below normal. The number of buyers in the market has decreased (no hard numbers here just anecdotal evidence from personal experience with showings and the number of offers) but there are still very few houses out there to look at.

Please flip through the slideshow below to get a better feel of the market.