This past week we saw good improvement in the number of new listings on the market. So far this year the activity in the market can be summarized as, buyers-plenty, sellers – not so much.
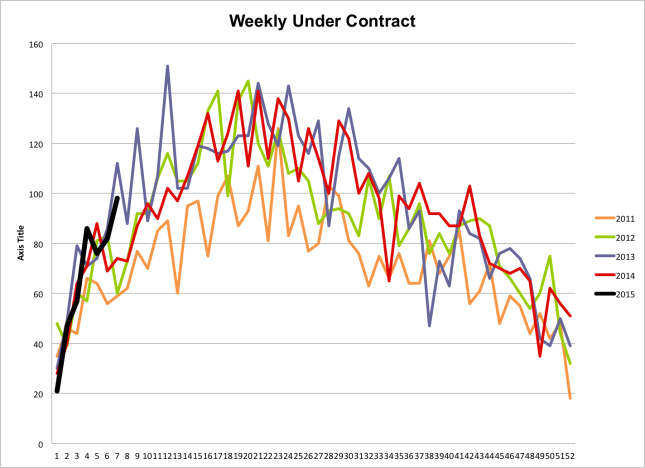
Every Thursday morning over the past five years I search the market and chart how many houses were listed, how many went under contract and how many have sold. The first chart here shows the number of homes that go under contract each week. The dark black line represents this year and as you can see it is in line with past years. In fact the past two weeks have exceeded last year by a good margin. Overall we have very strong demand.
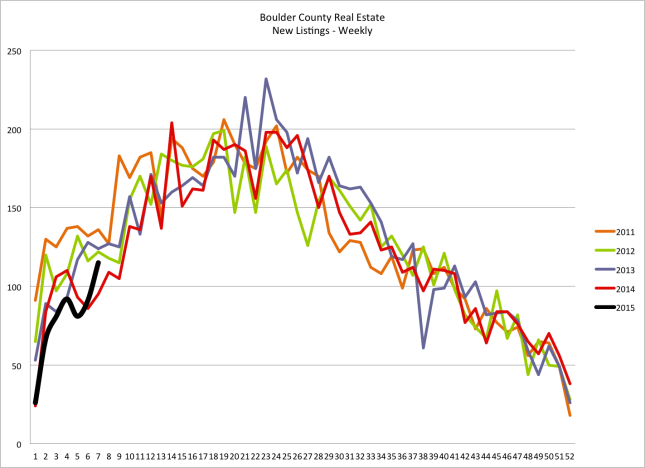
 On the other hand, supply has been lagging. Up until this past week the flow of new listings to the market has been very slow. Taking in concert with the steady demand, it’s easy to see why our inventory is at an all time low. I was showing a buyer homes yesterday in Boulder and there were 8 available listings in Boulder listed between $550,000 and $800,000. The chart below shows the flow of listings to the market on a weekly basis over the last five years. Most of this year the flow of new listings has been below that of recent years. Up until this past week. Maybe this is a sign that things are picking up.


