by Neil Kearney | Jan 18, 2018 | Boulder County Housing Trends, Statistics |
2017 Year In Review
Half-way through 2017 we saw a shift in the Boulder area real estate market. The first half of the year was a continuation of the very hot market we experienced in 2014-2016 with rapid price appreciation, low inventory and a strong sellers’ market. During the second half of the year we experienced a softer market characterized by homes staying on the market longer, more price reductions and more balanced negotiations.
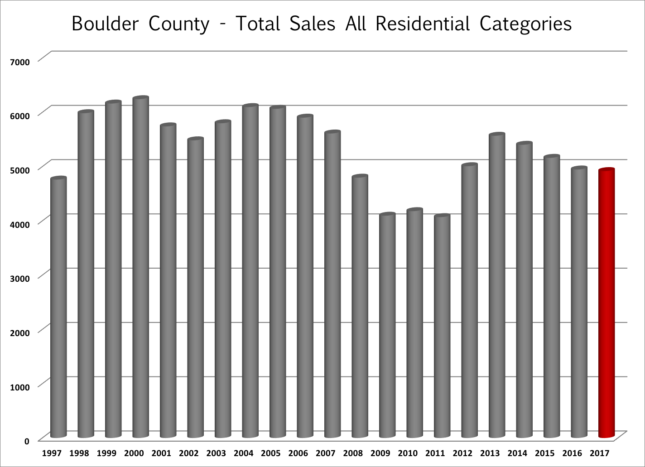
Here are some of the key statistics in Boulder County from 2017:
- Total sales were down 5% to 4,680 sales.
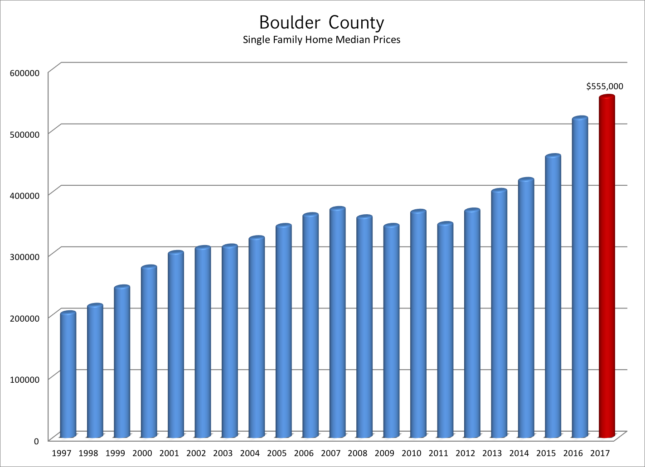
- The median price for all sales in 2017 was $480,000 which is up 6% from 2016.
- There were 490 sales that exceeded $1 million during the year which is 64 more than a year ago, 124 more than two years ago and 301 more than five years ago.
- At the end of December there were just 777 residential properties on the market in Boulder County and 331 of these were already under contract. This represents a low mark since I have been keeping track.
Over the past 10 years, owning real estate in Boulder County has been a great investment. Cumulative appreciation since 2007 has exceeded 60% with most of that occurring during the last five years.
What’s Been Driving The Market?
The United States is 8 ½ years into an expansion. This represents the 3rd longest consecutive expansion period since the Great Depression.[1]Colorado and especially Boulder County have benefitted from the strong economy. Colorado added approximately 60,000 new residents from migration and 56,300 new jobs in 2017. The unemployment rate in Colorado is 2.5% which is second best in the nation. Boulder County’s unemployment rate is 1.9%.
People come to Colorado for the strong economy, the sunny climate and the outdoor lifestyle. Telecommuting, e-business and a proliferation of startups is allowing many people to make their Boulder dreams come true. Colorado has an especially young population, 55% are between the ages of 20 and 59 and 25.4% are 19 or younger.[2] Despite earlier reports, millennials are in the market for and are buying homes.
Colorado’s population is expected to continue to grow. The current population of 5,538,180 (in July of 2016) is expected to grow to 8,461,000 over the next 30 years. With the proliferation of young, educated and a relatively highly paid workforce ($54,664 in Colorado and $74,615 in Boulder County[3]) it seems that Colorado in general and Boulder County in particular are set for continued growth.
Recently there has been a shortfall in new residential housing. Builders are building and neighborhoods are sprouting up wherever there is vacant land but the demand from newly formed households still exceeds the supply. Many of the newly constructed units of the last few years have been rental apartments and it seems that there is a bit of softening in the “for rent” market.
Where Are We In The Real Estate Cycle?
Real estate is cyclical. There are many factors involved, but the peaks and valleys of the real estate demand and value have been shown to have a relatively consistent cycle of approximately 18 years. Economist Homer Hoyt made a detailed study of the Chicago real estate market and the broader United States real estate market and found that it has run its course in a steady 18 year rhythm since 1800. There have been exceptions that have disrupted the normal cycle such as The Great Depression, World War II and the post war boom; but on average, the business cycle and the real estate cycle have been very consistent including the 18 year cycle than ended in 2008.
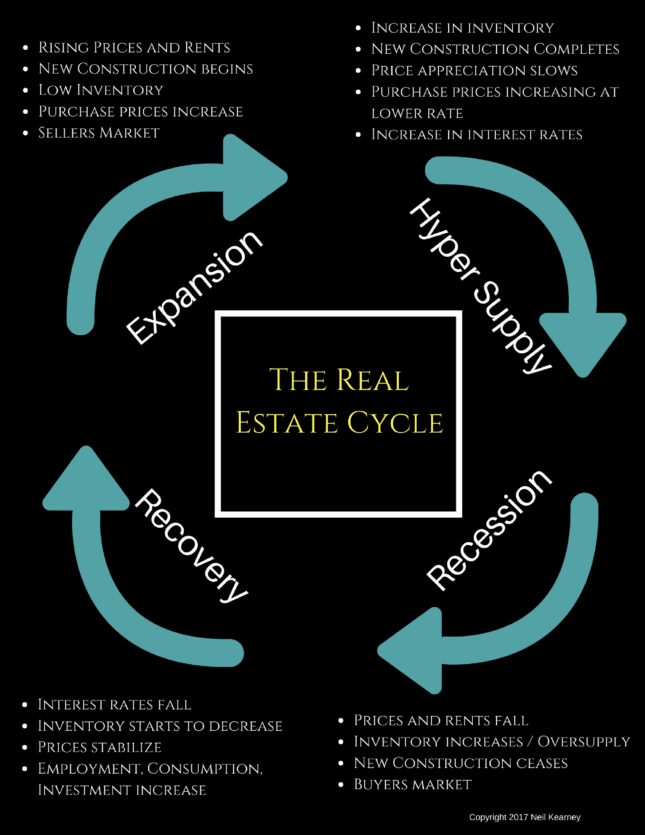
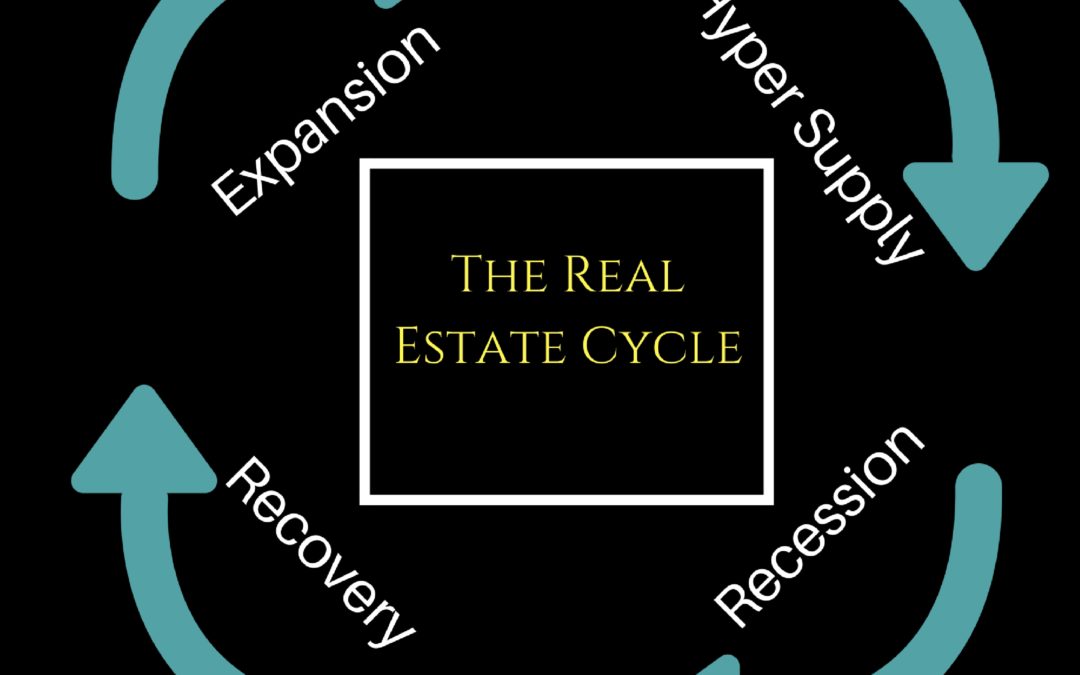
The infographic on this page shows the four phases of the real estate cycle; recovery, expansion, hyper-supply and recession. The last cycle ended in 2008 and we are almost 10 years into the recovery and expansion. To read more about this subject including the details of each stage of the real estate cycle go to www.NeilKearney.com/ 2017/12/05/the-real-estate-cycle-where-are-we-now/
The difficult question in any market is to know where you are now. First let’s eliminate where we know we are not. We are not in recession, nor are we in recovery. Over the last ten years, the Boulder area real estate market has come through the recession phase and then quickly moved through the recovery phase. I say quickly because we were fortunate not to have a big back log of foreclosure homes that needed to be sold. Since mid 2012 we have been in the expansion phase.
Throughout the Denver Metro Area we have seen unprecedented construction of rental apartments. We have seen a steady stream of new residents drawn to our area by a good economy and a great lifestyle.
We have seen compounding double-digit real estate appreciation that rivals the top markets in the nation. Early this summer, the temperature of the expansion seemed to have been turned down a few notches and we are now seeing a slowing in price appreciation and a bit less demand. However, our inventory is still very low and the overall economy is still doing well. We seem to be at the beginning of a cycle of increasing interest rates but a 30 year mortgage is still around 4%. To me it seems like we are still in the expansion phase, but if each phase was a day we would be definitely in the afternoon. Here are the next signs we need to look for which would indicate a shift toward the hyper supply phase: 1) increased vacancy rates on rental properties 2) Meaningful increase in interest rates 3) Increased inventory of resale homes for sale 4) New home builders offering incentives and price reductions.
If we are to believe that the real estate cycle runs in an 18 year cycle, we would expect our next major recession in 2024.
Home Price Appreciation
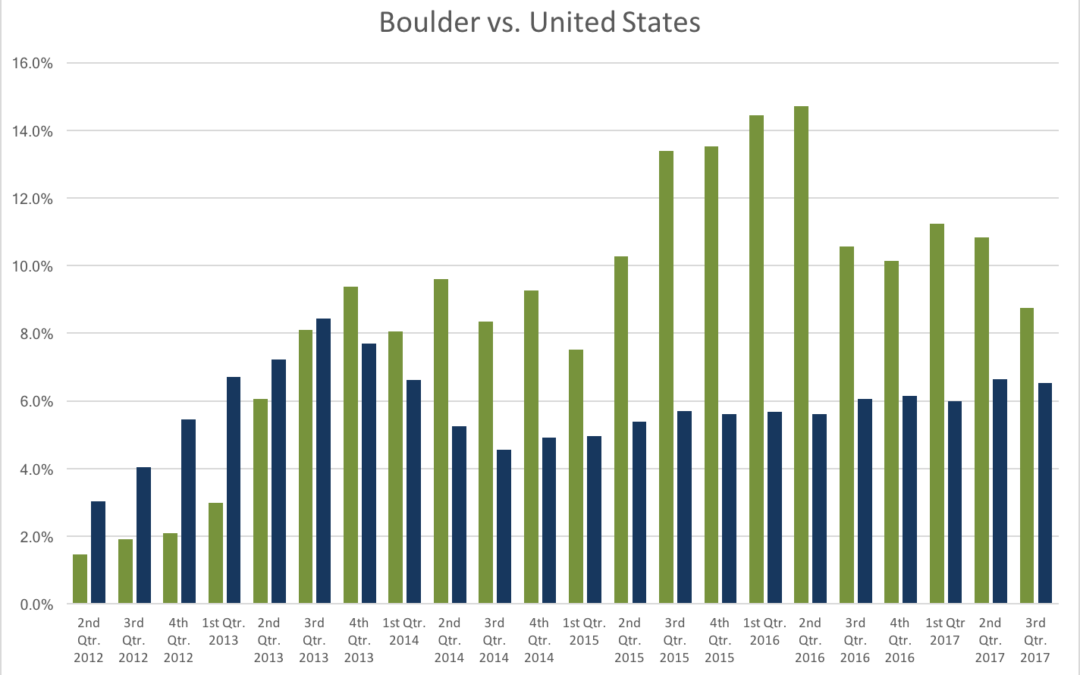
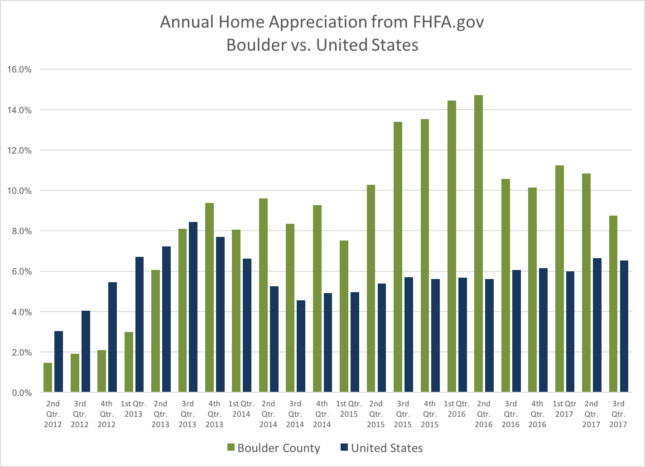
Since the second half of 2012 strong price appreciation has been the direct outcome of the positive household creation, lack of inventory, low interest rates and a growing economy. During the first two quarters of 2017 we saw a continuation of this strong trend. According to FHFA.gov the average home appreciated by 3.03% during the first quarter and 3.4% during the second quarter. The third quarter results from FHFA showed that Boulder had -.59% appreciation. This snapped a five year run of positive quarterly returns and may have signaled a change in the market. I will continue to track this to see if this was just a short break or if it was a shift.
One statistic that points to the fact that it may be an anomaly is active inventory. In a market that is losing steam you would expect to see a measureable gain in inventory, homes on the market. But at the end of December, and throughout the year inventory has not increased much at all.
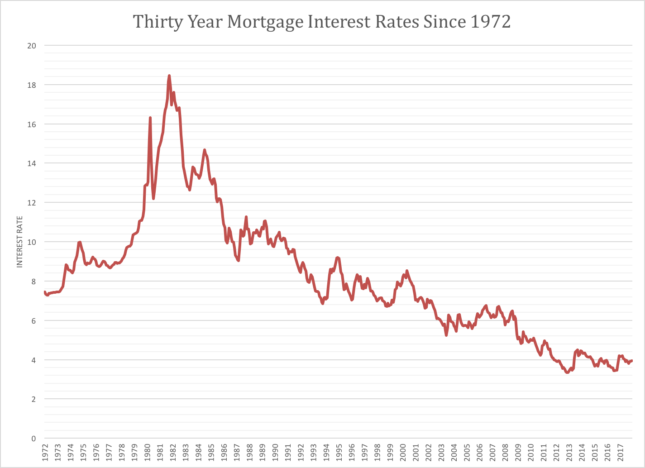
Affordability
As this is written in early 2017 long term mortgage rates are still hovering below 4%. This rate is still near the all-time lows (see the figure below). The Federal Reserve Bank is beginning to raise their short term interest rates and this might be the year that interest rates rise enough to cut into affordability. Affordability is the balance point for each potential purchaser between price, cost of money and income. Incomes are rising in Colorado but very slowly when compared to the increase in the price of real estate over the past five years.
The New Tax Bill and Its Effect On Real Estate
The recently passed federal tax bill will definitely have an impact on real estate. In general markets with high taxes and high values will be most affected. Despite the recent increase in local property taxes, Boulder County is considered a low property tax area compared to other parts of the country. However, we are a high value market. The issue is the reduction in the cap for eligibility for the mortgage interest deduction. Previously the cap was $1 million and it has now been reduced to $750,000. Not many people have loans in excess of $750,000, but in our area where the luxury home market is very robust, we may see fewer buyers able to make those purchases.
The Boulder County Treasurer was inundated before the new year with property owners pre-paying their property tax bill in advance. This was in response to the section of the tax bill which caps the deduction for state and local taxes at $10,000. Previously, homeowners were able to deduct from their federal tax return the amounts paid for state income tax, various ownership taxes and property taxes without limit. Now the deduction is limited to $10,000. Buyers may shy away from a house with a large tax bill knowing that payment will no longer reduce their tax bill.
The tax bill also increased the standard deduction and reduced business tax rates among many other changes, so it’s not easy to compute the individual effect. What has become apparent, is that the subsidy of real estate through income tax deductions is now reduced and it may affect property values.
The Future
It’s much easier to report the past than it is to predict the future. But that doesn’t stop us all from looking forward and trying to make sense of what is to come. The local real estate market did slow down last year. I don’t think anyone expected that it was to go forward at break neck speed indefinitely. However, I think there is still strength in the market. Population is growing, we have a shortage of homes, the economy is strong and people want to live here. One of our main challenges is reduced affordability caused by high prices and increasing interest rates. The 2018 Colorado Business Economic Outlook put out by the Leeds School of Business predicted home appreciation in the 3-5% range. This seems about right to me.
Now, more than ever you need a real estate advocate who has the experience and knowledge to lead you through this market. Neil Kearney, the owner and managing broker of Kearney Realty Co. has been a trusted resource for his clients in the Boulder real estate market for over 25 years. If you plan to buy or sell real estate, go with a local, trustworthy, award winning Realtor. As you start to plan a move, call Neil for a no obligation consultation.
[1] Leeds Business School’s “Colorado Business Economic Outlook 2018”
[2] IBID
[3] IBID
by Neil Kearney | Dec 19, 2017 | Boulder County Housing Trends, Statistics
Boulder real estate statistics. The numbers are in. Sales during November 2017 were down 4% when compared to a year ago and are down 6% for the year. Inventory is just below where we were a year ago. We have had some good recent activity so I expect that sales in December will be relatively strong. At the end of November 46% of the listings on the market were already under contract. Please see the embedded slideshow for all of the details. All data is taken from IRES MLS.
by Neil Kearney | Dec 13, 2017 | Boulder County Housing Trends, Statistics
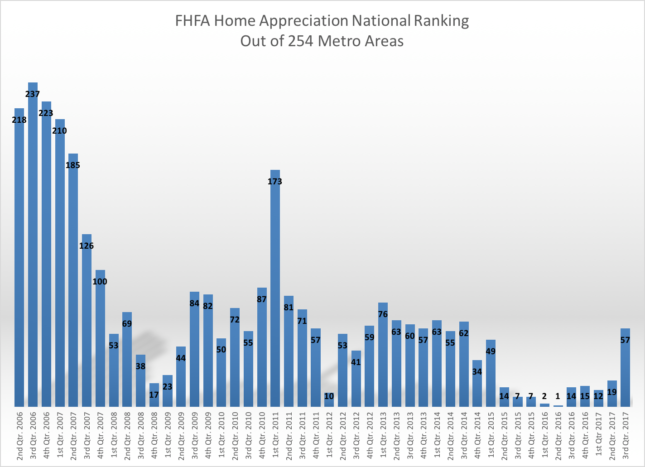
I began reporting in June that the market had shifted around Memorial Day. Since then, sales have declined when comparing same month closings. FHFA.gov recently released their quarterly “U.S. House Price Index” which reports on price appreciation in the 253 metropolitan areas in the United States. Looking at yearly appreciation, Boulder (the Boulder MSA includes all of Boulder County) shows an annual increase of 8.57% which is 57th best in the nation. Boulder County has been ranked in the top 20 each quarter since the 2nd quarter of 2015 so this recent ranking is a bit of a fall from the lofty perch we have recently been inhabiting. However, nearly 9% annual appreciation is still impressive and certainly above our historical average.
What was more concerning in the report was the appreciation rate for the 2nd quarter. The average home appreciation in Boulder County between July 1 and September 30th was a negative .59%. This is the first negative quarterly reading since 2nd quarter 2012, just before our market took off. This quarterly appreciation rakes us 12th from the bottom of the 253 markets. One quarter does not a trend make but it is something to watch and confirms the shift in the market. The first chart below shows the four quarter trailing annual appreciation for Boulder County and the United States. Over the past five years the cumulative appreciation has been 58.29%. The second chart below shows the ranking since 2006 (lower numbers show a better ranking).
Here are some other related articles that may give you some added context:
https://www.neilkearney.com/2017/09/05/summer-wrap-whats-next-boulder-real-estate-market/
https://www.neilkearney.com/2017/06/05/tracking-boulders-home-appreciation-time/
The Real Estate Cycle – Where Are We Now?
by Neil Kearney | Dec 5, 2017 | Boulder County Housing Trends, Boulder Real Estate, For Buyers, For Sellers, General Real Estate Advice, Real Estate 101
The Real Estate Cycle
Approximately 2500 years ago Heraclitus of Ephesus said “The only thing that is constant is change”. In the moment we sometimes forget that forces larger than we can see are slowly moving culture, markets and people. Everything we see is changing, however the rate of change makes a difference. We notice more readily the melting of an ice cream cone than the erosion of a mountain. It’s normal to only take note of what we can readily see. However, there is wisdom in taking a longer view.
Real estate is cyclical. There are many factors involved, but the peaks and valleys of the real estate demand and value have been shown to have a relatively consistent cycle of approximately 18 years. Economist Homer Hoyt made a detailed study of the Chicago real estate market and the broader United States real estate market and found that it has run its course in a steady 18 year rhythm since 1800. There have been exceptions that have disrupted the normal cycle such as The Great Depression, World War II and the post war boom but on average, the business cycle and the real estate cycle have been very consistent including the 18 year cycle than ended in 2008.
The infographic above shows the four phases of the real estate cycle. Here is more information on each of the stages of the cycle. Most studies present Recovery as the first phase of the cycle, but since the last recession was so memorable I think it makes a good starting point.
Recession
Think back to what was in the news in 2008 – 2011: Foreclosures, unemployment, short sales, mortgage reform, lowering interest rates, 40% drop in real estate sales, stock market losing value, declining home prices (Boulder was one of the few markets to hold most of its value), consumers reducing spending, rental vacancies, lower rents, incentives to buy and lease, etc. etc. The situation was shocking, many of the US real estate markets had just climbed to all time highs, buyers were using easy credit to buy multiple homes thinking that the easy money would continue indefinitely. And it did, until all of a sudden it crashed. Fortunes were lost. Especially for those who couldn’t hold on for the recovery. This was the low point in the economy and the real estate market. The signs to look for when recession is on the horizon are; interest rates are raised to slow an over heated economy, increased inventory of unsold homes, higher rental vacancies, new construction shows with more unsold inventory and higher interest rates (although some developers who are late to the party always get caught), mortgage delinquencies increase which leads to more foreclosures. During the recession it is a buyers market. Those with the wherewithal should purchase real estate at a discount.
Recovery
This is the bounce off the low point. During this phase the inevitable march of population slowly increases the demand for real estate and other goods. Accumulated inventory gets absorbed, vacant rental units get rented, adult children slowly move out of their parents basements, the Fed lowers interest rates to stimulate demand. With favorable interest rates businesses expand. They hire more employees, make capital investment. During this phase, prices stabilize, excess inventory gets purchased and there is virtually no new construction (developers are licking their wounds), in the aftermath of the recession, banks are very careful about lending.
Expansion
Recovery turns to expansion when most of the available inventory has been absorbed by individuals of businesses. Rental occupancy rates are higher than average, new construction finishes are at a low and stalled projects finish out, built up foreclosure inventory is all but gone. Once the expansion is recognized developers scramble to fill the new demand by planning new projects. However, developing property takes 2-3 years from start to finish so this isn’t instantaneous, there is a lag. With very little new construction the demand for re-sale homes is very strong. This results in rising prices and in some markets the supply demand discrepancy results in multiple offer situations that further exacerbate price increases. In times of unusually low inventory during this phase (before the new construction projects which have been in development are complete) prices tend to reflect an anticipation of where the market is headed rather than the current market price. This is a sellers market. As the expansion phase matures buyers and renters have increased choices but continue to find new places to live. Positive pressure on prices slows. The real estate market falls into a phase of balanced activity. As long as the broad economic forces are stable, this phase can last quite some time. People have jobs, they start families, they buy cars, the buy houses, they buy refrigerators. Companies are making profits, they continue to invest in infrastructure.
Hyper Supply
The delineation between market expansion and hyper supply is marked by an increase in unsold inventory and and increase in rental vacancy. The projects which were started late in the expansion phase continue to come available but to an increasingly tepid response. Growth in prices is decelerating. If developers recognize the turn in the market and stop building, the coming recession can be softened considerably. In this phase, housing, rental units and office space become over built. As interest rates rise we are then led into another recession.
Where Are We Now?
First let’s eliminate where we know we are not. We are not in recession, nor are we in recovery. Over the last ten years, the Boulder area real estate market has come through the recession phase and then quickly moved through the recovery phase. I say quickly because we were fortunate not to have a big back log of foreclosure homes that needed to be sold. Since mid 2012 we have been in the expansion phase. Throughout the Denver Metro Area we have seen unprecedented construction of rental apartments. We have seen a steady stream of new residents drawn to our area by a good economy and a great lifestyle. We have seen compounding double-digit real estate appreciation that rivals the top markets in the nation. Early this summer, the temperature of the expansion seemed to have been turned down a few notches and we are now seeing a slowing in price appreciation and a bit less demand. However, our inventory is still very low and the overall economy is still doing well. We seem to be at the beginning of a cycle of increasing interest rates but a 30 year mortgage is still at around 4%. To me it seems like we are still in the expansion phase, but if each phase was a day we would be definitely in the afternoon. Here are the next signs we need to look for which would indicate a shift toward the hyper supply phase: 1) increased vacancy rates on rental properties 2) Meaningful increase in interest rates 3) Increased inventory of resale homes for sale 4) New home builders offering incentives and price reductions.
If we are to believe that the real estate cycle runs in an 18 year cycle, we would expect our next major recession in 2024. If you would like to discuss a personal strategy as it pertains to the real estate cycle I invite you to contact me. Neil Kearney, Kearney Realty Co. Neil@NeilKearney.com 303-818-4055
by Neil Kearney | Nov 6, 2017 | Boulder County Housing Trends, Statistics
Sales Down – Inventory Stable – Increased Price Reductions and Negotiation
As we head toward the holidays and the end of the year it is normal to see a slow down in the market. During October sales were down 3.7% from last October and down 17% from two years ago but they were actually up by 12% from sales in the previous month. So while the overall trend shows a general slowdown in the market that started around Memorial Day, there is still some life in the market and sales are still happening. In October there were 392 closings in Boulder County.
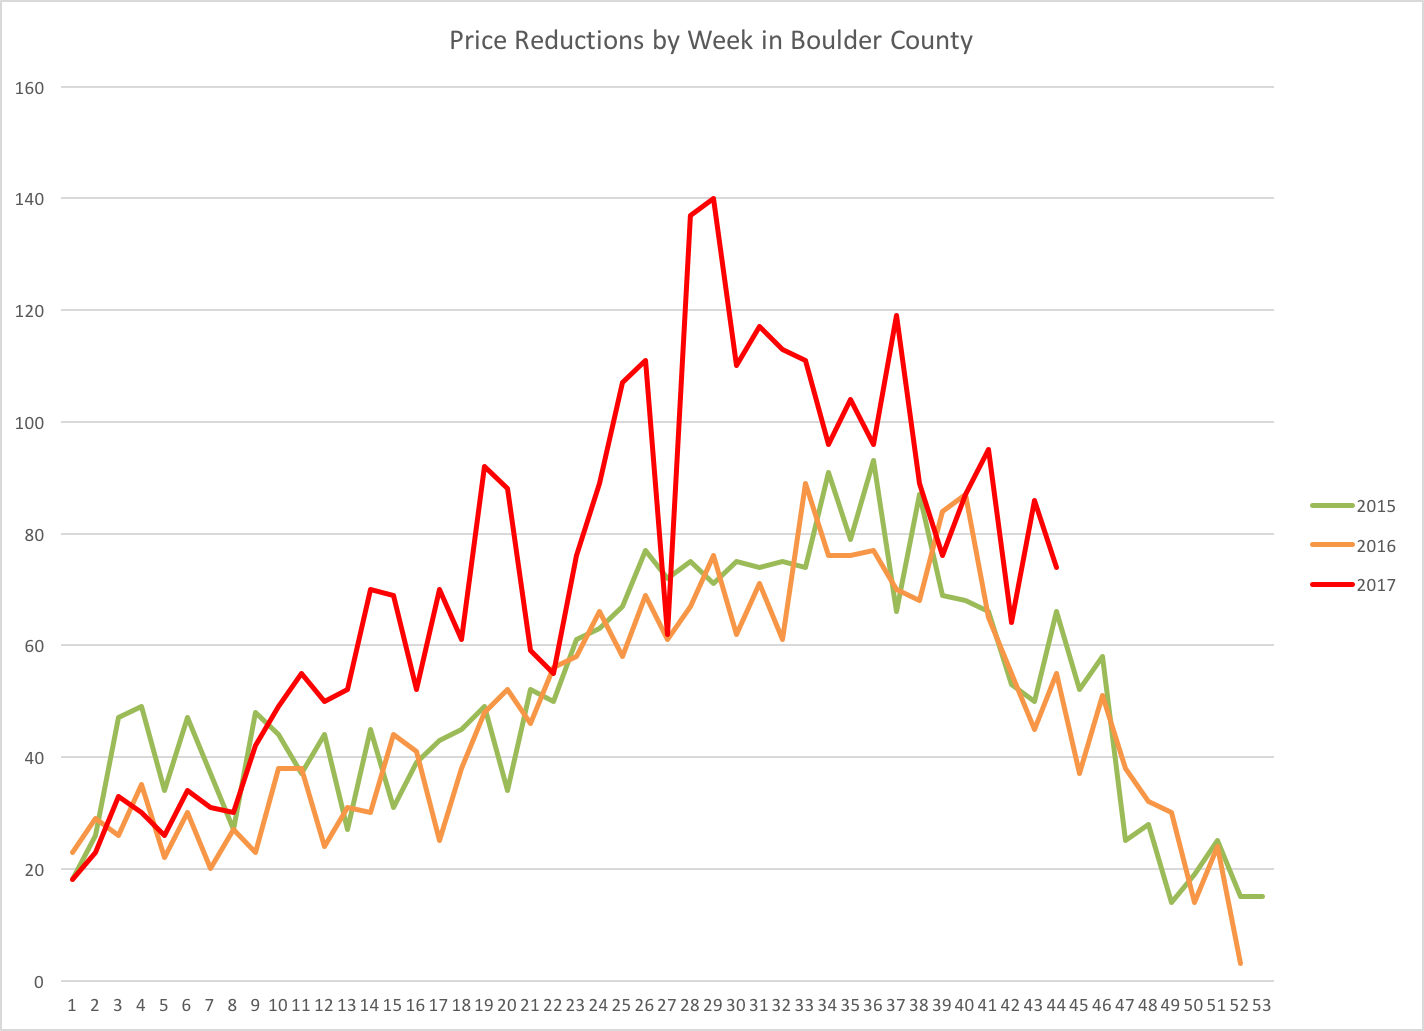
Inventory showed some good improvement during the first half of the year but over the past few months it has reverted to levels that are lower than last year. As the market has slowed we have seen a bit more negotiation (on average homes sold for 97.4% of list price which is roughly 1.4% lower than a year ago) in the market as well as many more price reductions (see the graph directly below).
All of the trends in the market are highlighted in the slide presentation below.
by Neil Kearney | Oct 27, 2017 | Boulder County Housing Trends, Statistics
The Kearney Report
 I’ve just published the latest Kearney Report which highlights the latest trends in Boulder County real estate and compares them to the longer term trends. I break up the county into a few smaller areas including Boulder, Longmont, East County (which includes Erie, Louisville, Lafayette and Superior) so that you can compare price ranges and other statistics in our different communities. You can view The Kearney Report below online or you can download the PDF here The Kearney Report 3rd Quarter 2017
Real Estate Market Update
At the end of the second quarter the Boulder area real estate market started to show signs that the strong sellers market that had been in place for over four years was wavering. The third quarter solidified that trend as sales slowed, negotiation edged toward neutrality, properties stayed on the market longer and price reductions were very common as sellers figured out that their optimistic expectations were not being realized in the market.
During the third quarter of 2017 there were 1,335 sales in Boulder County which reflects an 12% drop from the same quarter of the previous year. The median sales price during the quarter was $475,000 which is 8% higher than it was a year ago (the median price for sales during the second quarter were $500,000). Homes are staying on the market longer and this has given buyers more choices when looking.
During the second quarter, 31% of the homes sold for a price above the list price, this is down from 41% during the second quarter and 42% during the third quarter of 2016. The average premium paid on those properties that sold above full price was 2.8%, last year it was 4.04%. While still considered a seller’s market, we are shifting more toward neutral and buyers are able to negotiate rather than pay above list price in a majority of situations.
Here are some of the trends we are seeing in the market:
Trend #1 – Slowing Sales
Through the end of September sales in Boulder County were down 7% from a year ago. This alone isn’t such a big deal. What is more interesting is looking at sales on a monthly basis. Through March, cumulative sales in Boulder County were up by 6% over the same time period in 2016. The market was strong, multiple offer situations were common and houses were selling quickly. Sales tailed off a bit in April and May but that was due more to lack of inventory than anything else. Then right around Memorial Day the market noticeably slowed down. Houses that one would expect to sell quickly lingered on the market. We also started to see price reductions at a higher pace than previous years and the total number of sales dropped. Closings in June were down 12%, in July down 10%, in August down 14% and in September down 14%. We have definitely lsot some momentum in the volume of sales.
Trend #2 – Price Range Matters
When we speak about the average listing in Boulder County we are talking about a price range in Boulder County of roughly $500,000. When one deviates from that range the story can differ from what is reported. Over the past few years there has been a record number of sales over $1 million. However, the sales of homes in the luxury range have shown less of a seller’s market than lower price ranges. Currently there is 2.6 months of inventory on the market in the price range of $500,000 and lower; 2.91 months for those homes in the $500 – $750k range; 4.10 months for homes between $750,000 and $1 million; and 6.04 months for homes priced above 1 million. The National Association of Realtors has stated that 6 months of inventory is a balanced market.
Trend #3 – Interest Rates
At the end of September the average national 30 year mortgage interest rate was 3.83%. This is up slightly from a year ago but still below the five-year average. At the end of the day what matters to a potential home purchaser is if they can afford the payment. As prices rise, buyers slowly adjust to the new normal but if they can afford it and if their friends and colleagues are also buying homes, the price objection as a stand-alone issue dissolves as long as they can afford the payment. So when prices rise, like they have over the past five years affordability needs to come from somewhere. Buyers must either have their incomes increase in a proportional way, be able to bring a larger down payment, or interest rates must be low enough to allow for a reasonable payment relative to their overall monthly income. So far, interest rates are staying low and allowing for sustained sales. If we do see a spike in interest rates that compounds the effect of the recent price increases, we can expect to see demand fall and prices flatten. This flattening of prices has been the normal for the Boulder County market over the past 30 years after a period of rapid price gains.
Trend #4 – Price Appreciation Losing Some Steam
I’m splitting hairs a bit here because we have seen some slowing this summer on price appreciation. According to FHFA.gov Boulder County homes showed a 10.84% gain in value from June 2016 to June 2017. This was tied for 19th best in the nation with Portland OR. But the rise in inventory and the drop in sales this summer tell me that the pace of appreciation has slowed.
We have been blessed by a steady upward trending market without the up’s and downs that typically accompany high growth. Real estate is cyclical and it will be interesting to see where we are in the cycle over the next few years. Enjoy the report!
Be sure to click on “Full Screen” in the lower right corner.

