The Kearney Report – First Quarter 2018
 The Kearney Report – First Quarter 2018
To download and view the report, click this link –The Kearney Report 1st Quarter 2018
Or you can view the entire report online below.

The Kearney Report – First Quarter 2018
To download and view the report, click this link –The Kearney Report 1st Quarter 2018
Or you can view the entire report online below.
How’s the market? Overall it’s good. Sales are down roughly 4% through the first three months of the year. To me the market demand seems strong enough, but the low inventory has reduced the possibilities of a buyer finding the right house. It’s
The strength of the market definitely depends upon the price of the home. Here is a quick indication of the strength of the market by price range:
Price Range Active Listings # Under Contract % Under Contract
Under $1 Million 376 424 53%
$1 – $2 Million 121 69 38%
Over $2 Million 79 17 18%
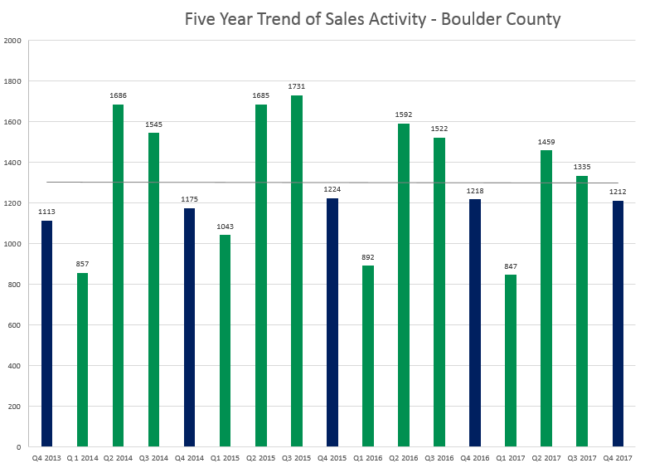
View the slideshow below for a complete update on the market including comparison over the past five years.
It seems that the spring market is in full swing. Inventory is low and we are seeing multiple offers across many price ranges. Especially competitive are lower price ranges in each of the communities across Boulder County. See the full presentation of the monthly statistics to see the full picture.
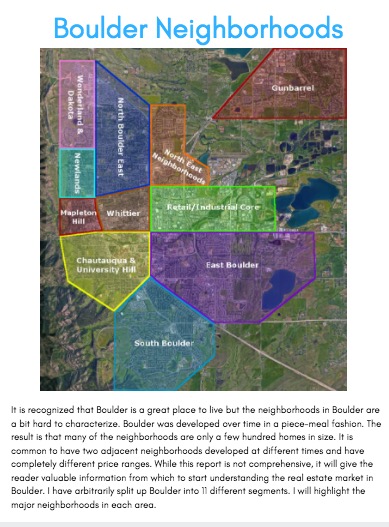
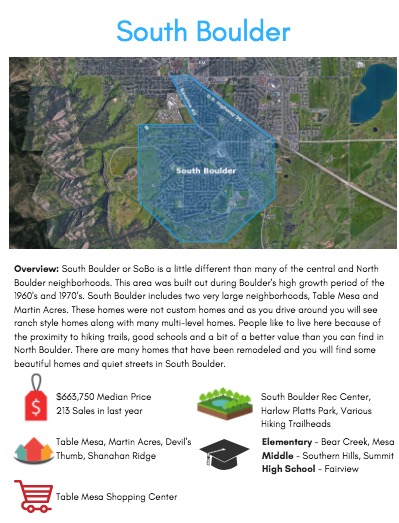
 I realized a few years ago that people coming from out of town were having a hard time characterizing the different neighborhoods within Boulder. In response I created The Boulder Neighborhood Guide. In this report I have split Boulder into eleven different areas and present the lifestyle highlights, schools, shopping districts, local recreation and basic real estate statistics for each area. If you’re interested in learning more about the different neighborhoods within the City of Boulder this may be helpful.
I have just finished updating The Boulder Neighborhood Guide for 2018 and invite you to view or download it. Here is a PDF copy Boulder Neighborhood Guide 2018
If you are visiting Boulder you may be interested in where to stay, where to eat, things to do and how to get around. You may also be interested in walking some of Boulder’s neighborhoods. I have created a few self-directed walking tours in Boulder that may be fun if you are visiting town. To access all of that information go my “Visiting Boulder Page”
 The Kearney Report – 4th Quarter 2017
I have just finished up The Kearney Report for the 4th Quarter 2017. This report gives an in depth view of the real estate market in Boulder County as well as in the sub-areas of; City of Boulder, City of Longmont and East County (Louisville, Lafayette, Superior, Erie). To download and view the report click this link The Kearney Report 4th Quarter 2017 I always provide my reports to you free of charge and without the need to sign up for a list. You can also view it online below.
We saw a big drop in sales and activity during the 3rd quarter. During the 4th quarter the market stabilized. Sales in Boulder County were roughly equal to where they were during the 4th quarter of 2016. Here are a few highlights for the quarter (mostly compared with 4th quarter 2016):
Boulder County:
City of Boulder:
City of Longmont:
East County (Louisville, Lafayette, Superior, Erie):
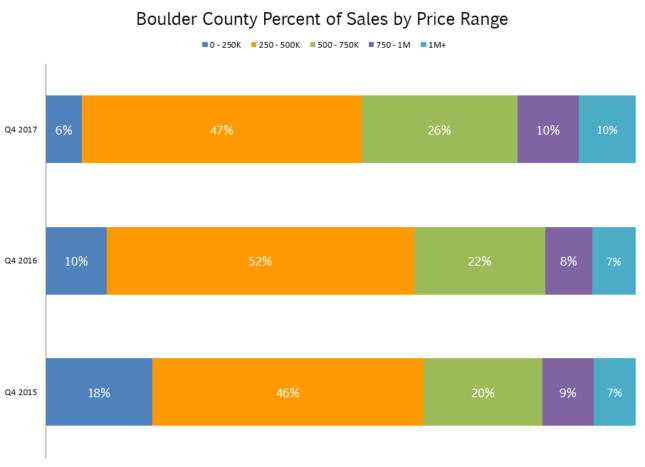
Here are some selected graphs from the report.
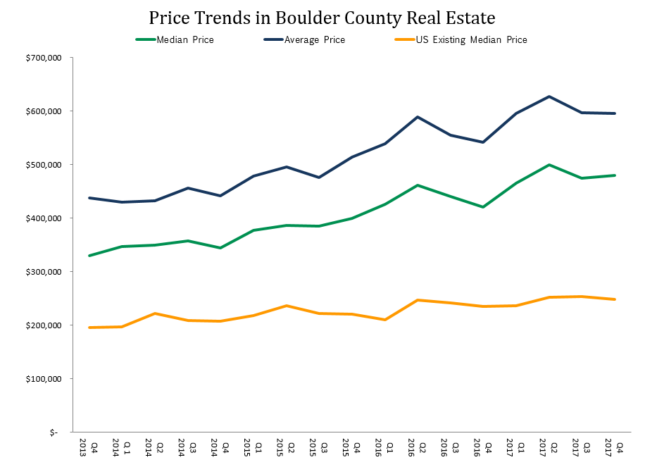
The Boulder real estate market ended on a strong note in December of 2017. Sales for the month were up 3.5% compared to December of 2016. This good activity is also translating into a strong start for 2018. The slideshow below gives a good overview of the market in 8 quick slides.
Sales for 2017 in its entirety were down 5.4%; prices were up approximately 6% with much of that appreciation occurring in the first half of the year.

Broker/Owner
Kearney Realty Co.
303.818.4055