by Neil Kearney | Sep 20, 2017 | Boulder County Housing Trends, Statistics
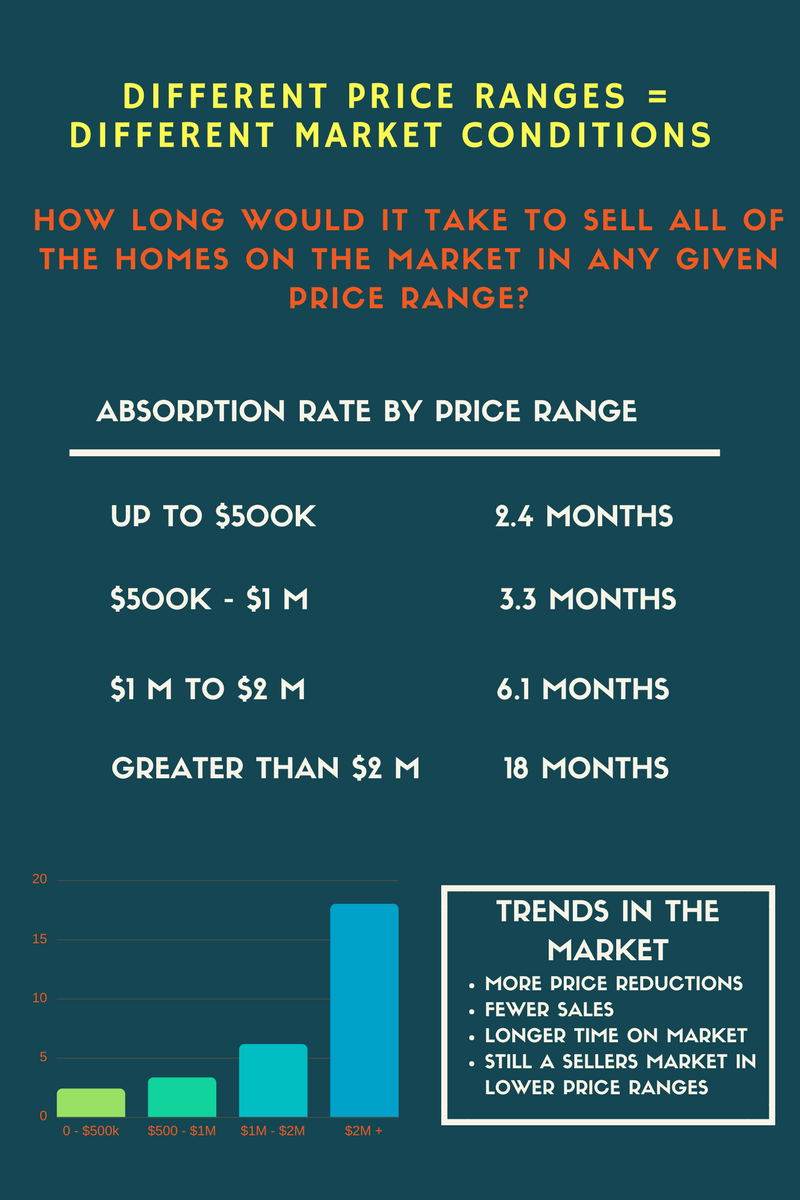
In a recent market update I outlined how we are seeing more price reductions, fewer sales and that the market seems to be shifting away from a strong sellers market. However, there are still pockets in the Boulder County market where most of the houses are under contract. As I looked further I found that these “pockets” around the county all seemed to be in the lower price range of their community. The graphic below shows the absorption rate of the inventory throughout Boulder County in different price ranges. Think of it this way, if we froze the market and accepted no new listings but sales happened at the rate they have been happening over the past three months, how long would it take to sell all of the listings. According to NAR (National Association of Realtors) a balanced market is 6 months. Anything less than that is a sellers market and more is a buyers market. So what we have is a sellers market under $1 million, a balanced market between $1 million and $2 million and a buyer’s market above $2 million.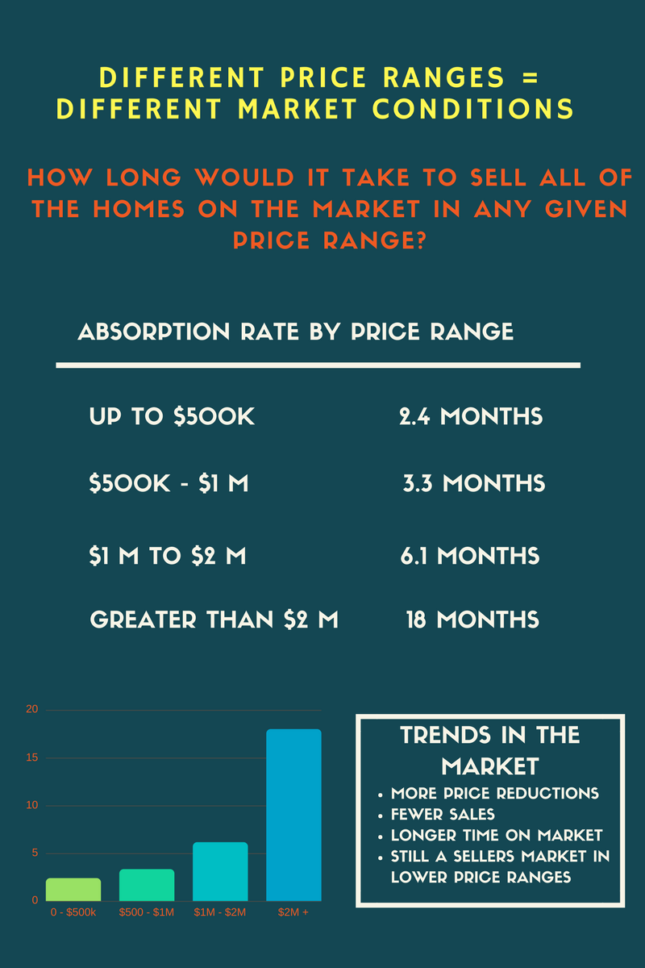
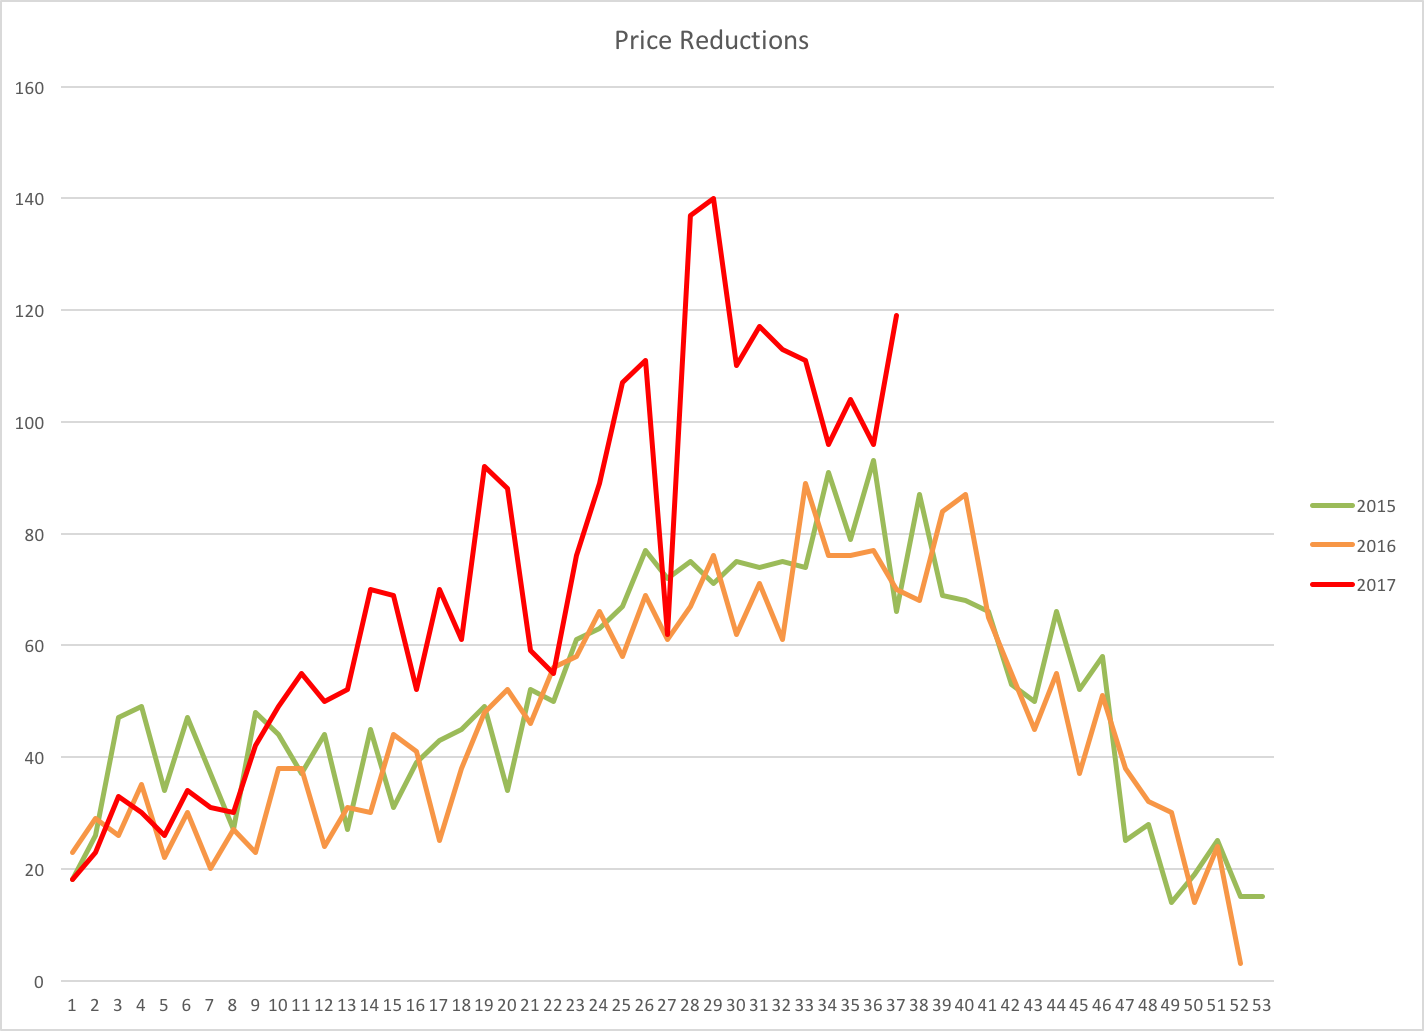
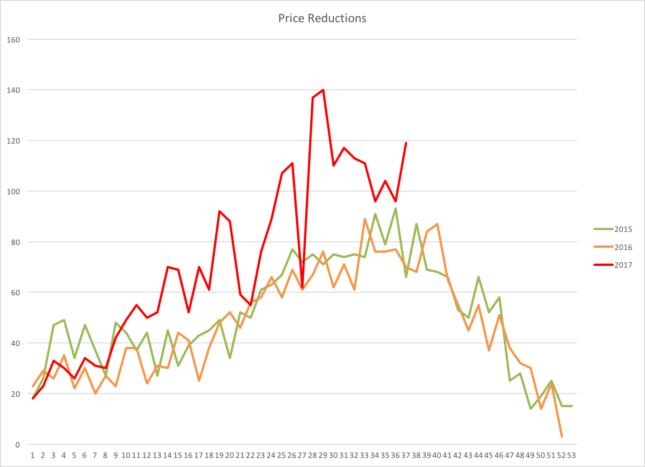
Another interesting graph that helps to tell the story of the market is below and it shows the number of price reductions in the market on a weekly basis over the past three years. 2015 and 2016 were markets characterized by multiple offers and above asking price sales. 2017 started out in much the same way but by the end of spring we were seeing some softening. One way to see this softening graphically is in the number of price reductions.
by Neil Kearney | Sep 13, 2017 | Boulder County Housing Trends, Statistics
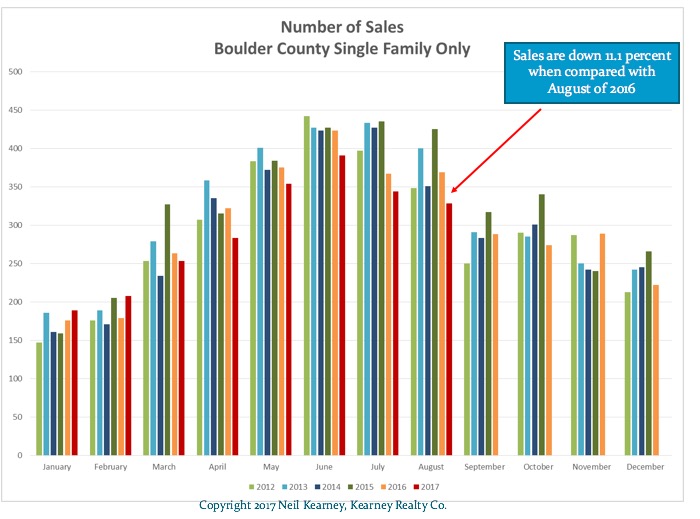
The real estate statistics for Boulder County for the last few months have shown a shift in the market. August continued this trend. Sales during the month were 11% lower than last year and lower than any August since 2011. We are seeing more price reductions, more negotiation room and it’s taking longer for homes to sell. It seems that we are shifting away from a strong sellers market to a more balanced market. View the presentation below to see multiple statistics pointing in the same direction.

by Neil Kearney | Sep 5, 2017 | Boulder County Housing Trends, Statistics
Market Update
The next sixty days will tell us much about the direction of the real estate market in Boulder County. If you are reading this newsletter, you are aware that our market has been on a torrid pace since 2013. Over the past five years the average home has appreciated in value by over 60%[1] . A year ago, during the second quarter, our annual appreciation rate was ranked number 1 in the nation. In short, our market has been sizzling hot. As I have written about before, net migration to the area, a strong economy, a desirable lifestyle and a shortage of housing and buildable land have been the major drivers of this trend. However, anyone who pays attention to markets over the long term knows that all markets are cyclical. In this short update I will highlight some current trends in the market and see what that might mean for the future.
Trend #1 – Slowing Sales
Through the end of July, sales in Boulder County were down 3% from a year ago. This alone isn’t such a big deal. What is more interesting is looking at sales on a monthly basis. Through March, cumulative sales in Boulder County were up by 6% over 2016. The market was strong, multiple offer situations were common and houses were selling quickly. Sales tailed off a bit in April and May but that was due more to lack of inventory than anything else. Then right around Memorial Day the market noticeably slowed down. Houses that one would expect to sell quickly lingered on the market. We also started to see price reductions at a higher pace than previous years and the total number of sales dropped. Closings in June were down 12% from the prior year and down 10% in July.
Trend #2 – Increasing Inventory
In 2015, inventory of available homes in the market dropped dramatically. At the same time demand for homes started to spike. The result was crazy price appreciation. Last year, especially in the third and fourth quarters we saw our inventory rise. This year that trend has increased. We are not back to 2014 levels but buyers are starting to have more to look at and properties are staying on the market longer.
Trend #3 – Price Range Matters
When we speak about the average listing in Boulder County we are talking about a price range in Boulder County of roughly $500,000. When one deviates from that range the story can differ from what is reported. Over the past few years there has been a record number of sales over $1 million. However, the sales of homes in the luxury range have shown less of a seller’s market than lower price ranges. Currently there is 2.8 months of inventory on the market in the price range of $500,000 and lower; 3.4 months for those homes in the $500 – $750k range; 4.4 months for homes between $750,000 and $1 million; and 7.7 months for homes priced above 1 million. The National Association of Realtors has stated that 6 months of inventory is a balanced market.
Trend #4 – Interest Rates
At the end of July the average national 30 year mortgage interest rate was 3.97%. This is up slightly from a year ago but still below the five-year average. At the end of the day what matters to a potential home purchaser is if they can afford the payment. As prices rise, buyers slowly adjust to the new normal but if they can afford it and if their friends and colleagues are also buying homes, the price objection as a stand alone issue dissolves as long as they can afford the payment. So when prices rise, like they have over the past five years affordability needs to come from somewhere. Buyers must either have their incomes increase in a proportional way, be able to bring a larger down payment, or interest rates must be low enough to allow for a reasonable payment relative to their overall monthly income. So far, interest rates are staying low and allowing for sustained sales. If we do see a spike in interest rates that compounds the effect of the recent price increases, we can expect to see demand fall and prices flatten. This flattening of prices has been the normal for the Boulder County market over the past 30 years after a period of rapid price gains.
Trend #5 – Price Appreciation Losing Some Steam
I’m splitting hairs a bit here because we have seen some slowing this summer on price appreciation. According to FHFA.gov Boulder County homes showed a 10.84% gain in value from June 2016 to June 2017. This was tied for 19th best in the nation with Portland OR. But the rise in inventory and the drop in sales this summer tell me that the pace of appreciation has slowed.
Conclusion
There is a normal slow down during the summer months in our area, but when I compare the market conditions of this summer to past summers the slow down seems to have happened earlier and had more price reductions this summer than in the past. Only time will tell if this was just a temporary pause of if the market has shifted a bit toward the buyer. That is why the next 60 days is so important. I will let you know how it turns out.
[1] FHFA.gov Home Price Index 2nd Qtr. 2017

by Neil Kearney | Aug 24, 2017 | Boulder County Housing Trends, Statistics
Right around Memorial Day we saw a shift in the market. At that point properties started staying on the market longer, inventory started rising and sales started to drop. It’s normal in Boulder County to have a slow down during the summer but this year it began earlier than usual. This decrease in sales coupled with an increase in inventory has led to a slowing of price appreciation in the county. Is this a shift in the market or just a seasonal slow down? The next 30 to 60 days will tell a lot. What happens during the fall will give us a good indication of what to expect next winter and spring.
See the presentation above for a more in depth view of the market as well as graphs and statistics.
by Neil Kearney | Aug 3, 2017 | Boulder County Housing Trends, Statistics
 I have just completed the latest edition of The Kearney Report for the second quarter 2017. The goal of this report is to give you a quick understanding of the statistics and trends in the Boulder County real estate market.
You can view the entire report below or you can download the PDF here. The Kearney Report 2nd Quarter 2017
Real Estate Market Update
During the second quarter of 2017 the Boulder area real estate market continued to be a strong sellers market, but towards the end of the quarter there was a change in the market. In this summary I will discuss these trends as well as discuss what we might expect to see during the third and fourth quarter of the year.
During the second quarter of 2017 there were 1,459 sales in Boulder County which reflects an 8.3% drop from the same quarter of the previous year. The median sales price during the quarter was $500,000 which is ironically 8.3% higher than it was a year ago. Inventory this year has been been consistently higher than the past two years and this has given buyers more choices when looking. This was especially true at the end of May when the levels of active inventory were above 2016 and 2015 levels, equal to 2014 levels and just below 2013 levels. During the second quarter, 41% (50%) of the homes sold for a price above the list price, 22% (20%) were at the asking price and 36% (30%) were below. When comparing this years numbers to last years, which are shown in parenthesis, it’s clear that the market has stepped back a bit from the record market of a year ago. Of those that did sell above list price, the average premium paid was 3.76% which is down from 4.4% a year ago. Still an impressive number of homes selling above list price, but there were fewer that did and those buyers that had to pay a premium paid less of one.
Through mid May the market was cruising along, homes were selling quickly and there didn’t seem to be much inventory in most price ranges. A week before Memorial Day we felt a shift in the market. New listings that we expected to sell quickly sat on the market. We started to see more price reductions and before long it wasn’t uncommon for houses to be on the market for 20 or more days where before 7-14 was the norm before finding a buyer. Since there is a 30-45 day gap between when a house goes under contract and when it closes Mays statistics still looked good, sales down just 1.8%. However, sales dropped by 12% in June and at the end of June the percentage of properties that were under contract compared to all active listings had fallen over 14 percentage points compared to a year ago and were at 44%.
The slowdown in the market may be just seasonal. It is normal to experience a slow down in the market over the summer as people go on vacations and enjoy all that Colorado has to offer in the summer. However, a slowdown in the middle of May is earlier than usual. It could be that after three years of a relentless seller’s market buyers needed a break. The true test will be in September when, over the past three years we have felt momentum build again until the holidays. We’ll keep you posted.
The Boulder County real estate market has been one of the most robust markets in the nation over the past decade. According to FHFA.gov Boulder ranks 28th in the nation over the last five years in appreciation. When I looked at the markets that have outpaced us over the past five years I found many markets that are more “boom and bust” than ours. I then looked at cumulative returns over the past 10 years and found that the Boulder market was a close second only to Denver, above San Francisco and Portland. We have been blessed by a steady upward trending market without the up’s and downs that typically accompany high growth. Real estate is cyclical and it will be interesting to see where we are in the cycle over the next few years. Enjoy the report!
by Neil Kearney | Jun 5, 2017 | Boulder County Housing Trends, Statistics
Boulder County Has One of the Most Consistently Strong Real Estate Markets In The Nation
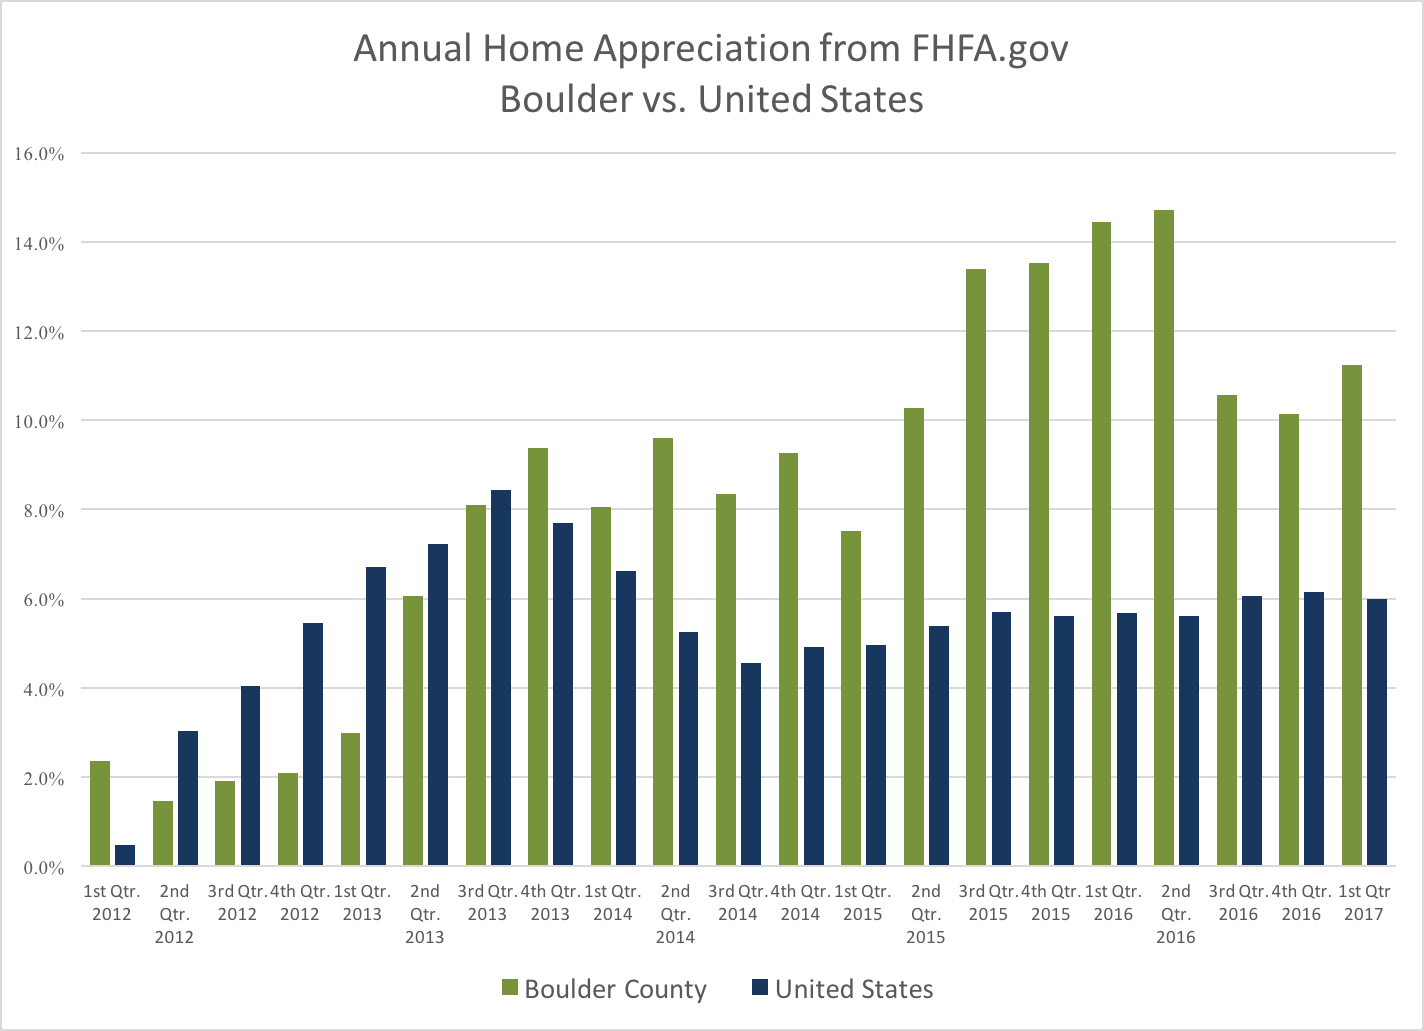
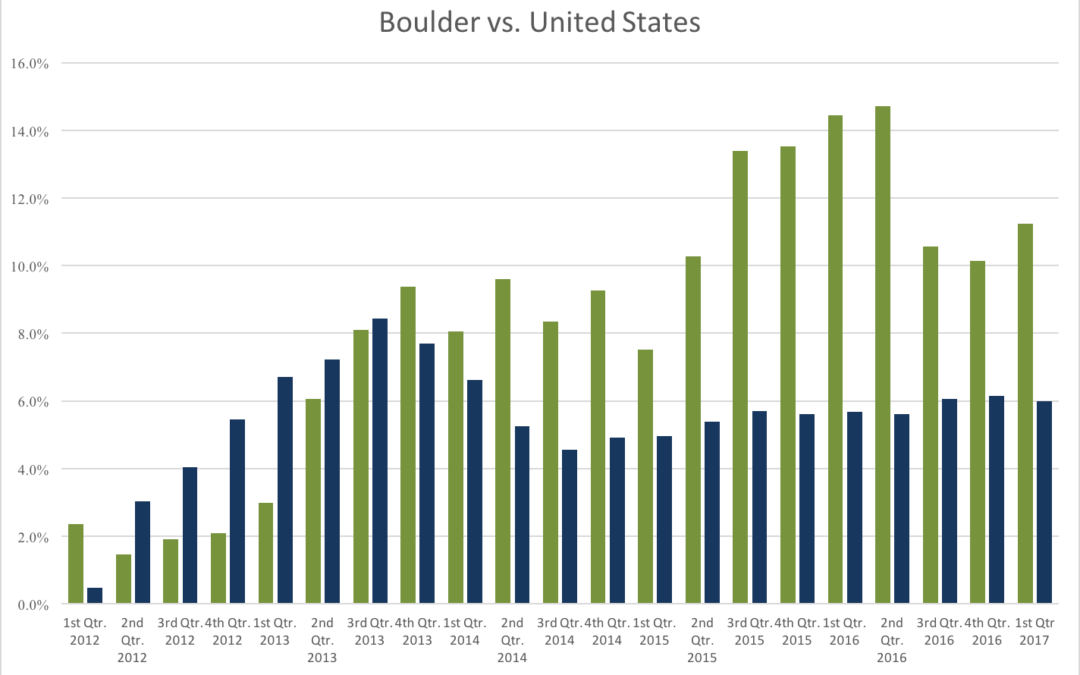
According to the most recent FHFA.gov Home Price Index quarterly report the one year appreciation in Boulder County for the period ending March 31, 2017 was 11.23%. This ranks us 12th highest in the nation out of the 257 largest Metropolitan Statistical Districts that were studied. Our area has been ranked in the top 15 for eight straight quarters including a #1 ranking for the period ending June 30th 2016. The first chart below shows the annual appreciation reported on a quarterly basis for both Boulder County (green) and the United States average (blue). The last five years have been one of our strongest “bull runs” in our history. Over the past five years, the average home has appreciated 55%.

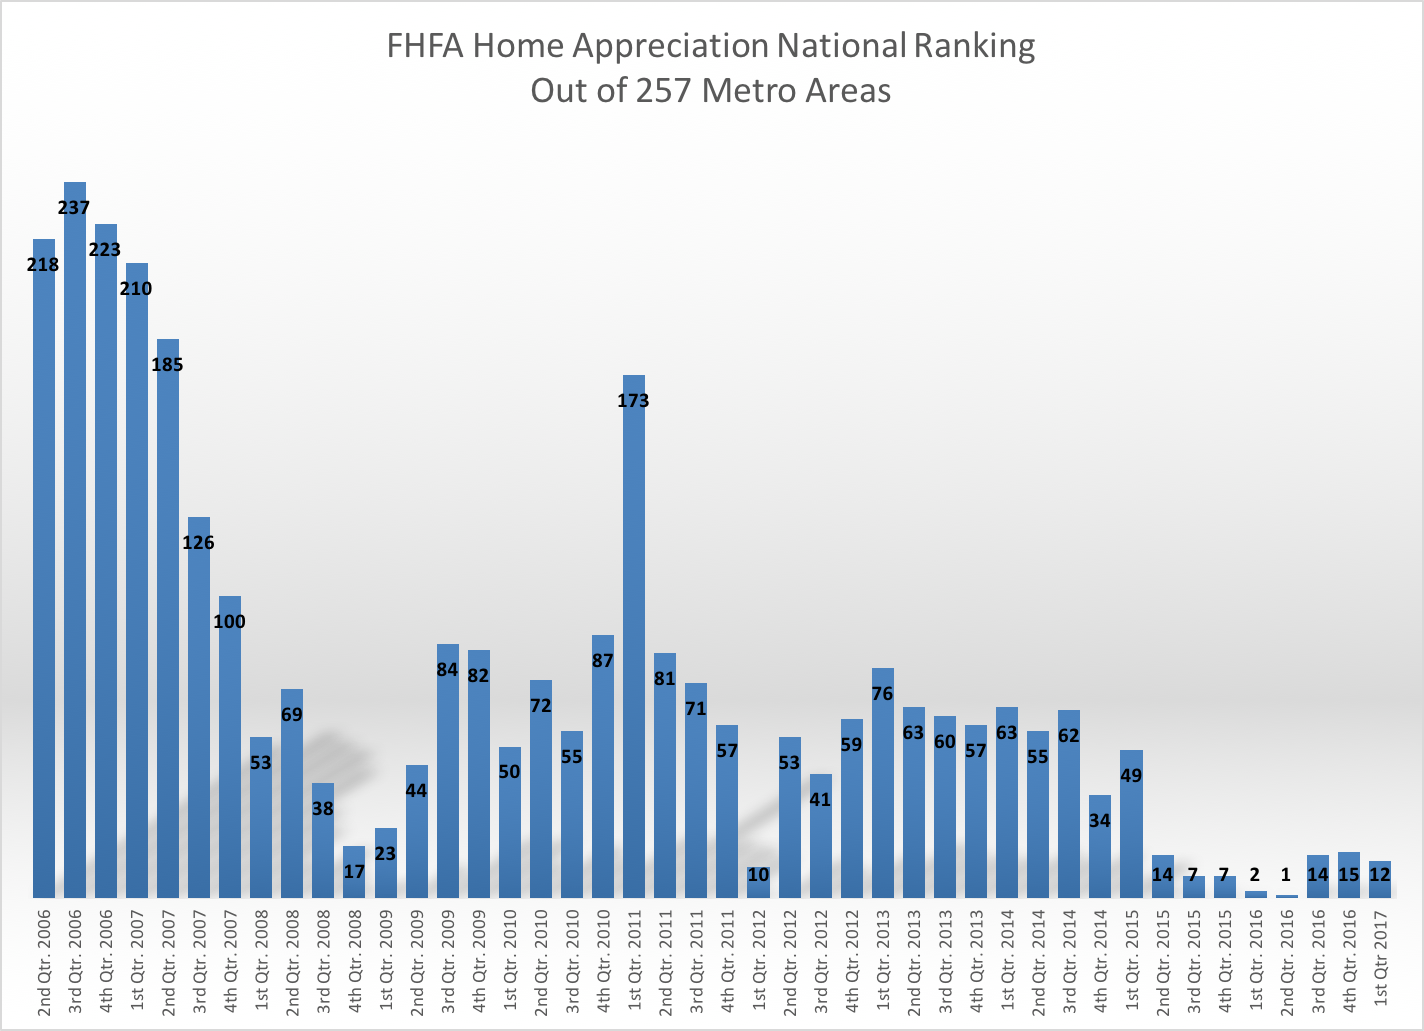
The chart below shows our national ranking compared to the 257 other markets in the FHFA report since 2nd quarter of 2006. This is an interesting graph because it shows that just before the economic downturn in 2008 our market was actually in the last quartile. Our annualized returns at that time were in the 1 to 3% range. As the downturn started and the real estate market came to a grinding halt our ranking improved compared to the rest of the country. During 2008 our appreciation remained above +2%. From 2009 – 2011 our average annual appreciation ranged from +2% to -2.8%. It turns out that we were one of the most stable markets in the country.

This got me to thinking about how we compare to other currently “hot” markets over the last 5 and 10 year time frames. First I identified the areas that currently are ahead of Boulder County in appreciation over the past five years. With 55% appreciation we are ranked 28th in the nation. Reno, NV is ranked #1 with 86% appreciation over the past five years. Here is the list showing the ranking over the past five years. The table is sorted by the highest to lowest in the bolded column.
| City |
2007-2012 Appreciation |
20012-2017 Appreciation |
10 Year Appreciation |
|
| Reno, NV |
-51% |
86% |
35% |
1 |
| Modesto, CA |
-58% |
84% |
26% |
2 |
| Stockton, CA |
-57% |
82% |
25% |
3 |
| Bend, OR |
-43% |
79% |
36% |
4 |
| Las Vegas, NV |
-60% |
78% |
18% |
5 |
| Merced, CA |
-61% |
75% |
14% |
6 |
| San Francisco, CA |
-21% |
73% |
52% |
7 |
| Oakland, CA |
-35% |
73% |
38% |
8 |
| Santa Rosa, CA |
-37% |
69% |
32% |
9 |
| West Palm Beach, FL |
-46% |
69% |
23% |
10 |
| Napa, CA |
-40% |
69% |
29% |
11 |
| Port Lucie, FL |
-52% |
68% |
16% |
12 |
| Yuba City, CA |
-49% |
67% |
18% |
13 |
| Sarasota, FL |
-47% |
67% |
20% |
14 |
| Cape Coral, FL |
-50% |
67% |
16% |
15 |
| Phoenix, AZ |
-48% |
67% |
19% |
16 |
| San Jose, CA |
-23% |
66% |
43% |
17 |
| Salinas, CA |
-51% |
66% |
14% |
18 |
| Sacramento, CA |
-43% |
64% |
21% |
19 |
| Miami, FL |
-46% |
64% |
18% |
20 |
| Denver, CO |
-5% |
62% |
57% |
21 |
| Riverside, CA |
-49% |
62% |
14% |
22 |
| Palm Bay, FL |
-47% |
62% |
15% |
23 |
| Portland, OR |
-22% |
59% |
36% |
24 |
| Boise, ID |
-36% |
58% |
22% |
25 |
| Daytona Beach, FL |
-49% |
57% |
8% |
26 |
| Greeley, CO |
-13% |
57% |
44% |
27 |
| Boulder, CO |
2% |
55% |
56% |
28 |
Now here is the list sorted for the previous five year time period 2007 – 2012. This represents the end of a bull market in many areas and then through the heart of the housing recession. During this time period Boulder is ranked #1 with 2% appreciation, Denver is ranked #2 with -5%.
| City |
2007-2012 Appreciation |
20012-2017 Appreciation |
10 Year Appreciation |
| Boulder, CO |
2% |
55% |
56% |
| Denver, CO |
-5% |
62% |
57% |
| Greeley, CO |
-13% |
57% |
44% |
| San Francisco, CA |
-21% |
73% |
52% |
| Portland, OR |
-22% |
59% |
36% |
| San Jose, CA |
-23% |
66% |
43% |
| Oakland, CA |
-35% |
73% |
38% |
| Boise, ID |
-36% |
58% |
22% |
| Santa Rosa, CA |
-37% |
69% |
32% |
| Napa, CA |
-40% |
69% |
29% |
| Sacramento, CA |
-43% |
64% |
21% |
| Bend, OR |
-43% |
79% |
36% |
| Miami, FL |
-46% |
64% |
18% |
| West Palm Beach, FL |
-46% |
69% |
23% |
| Palm Bay, FL |
-47% |
62% |
15% |
| Sarasota, FL |
-47% |
67% |
20% |
| Phoenix, AZ |
-48% |
67% |
19% |
| Riverside, CA |
-49% |
62% |
14% |
| Daytona Beach, FL |
-49% |
57% |
8% |
| Yuba City, CA |
-49% |
67% |
18% |
| Cape Coral, FL |
-50% |
67% |
16% |
| Reno, NV |
-51% |
86% |
35% |
| Salinas, CA |
-51% |
66% |
14% |
| Port Lucie, FL |
-52% |
68% |
16% |
| Stockton, CA |
-57% |
82% |
25% |
| Modesto, CA |
-58% |
84% |
26% |
| Las Vegas, NV |
-60% |
78% |
18% |
| Merced, CA |
-61% |
75% |
14% |
When you sort for total appreciation over the past 10 years (right column) you see that Denver and Boulder are neck and neck with 57% and 56% respectively. San Francisco is ranked in 3rd place with 52%.
| City |
2007-2012 |
20012-2017 |
10 Year Appreciation |
| Denver, CO |
-5% |
62% |
57% |
| Boulder, CO |
2% |
55% |
56% |
| San Francisco, CA |
-21% |
73% |
52% |
| Greeley, CO |
-13% |
57% |
44% |
| San Jose, CA |
-23% |
66% |
43% |
| Oakland, CA |
-35% |
73% |
38% |
| Portland, OR |
-22% |
59% |
36% |
| Bend, OR |
-43% |
79% |
36% |
| Reno, NV |
-51% |
86% |
35% |
| Santa Rosa, CA |
-37% |
69% |
32% |
| Napa, CA |
-40% |
69% |
29% |
| Modesto, CA |
-58% |
84% |
26% |
| Stockton, CA |
-57% |
82% |
25% |
| West Palm Beach, FL |
-46% |
69% |
23% |
| Boise, ID |
-36% |
58% |
22% |
| Sacramento, CA |
-43% |
64% |
21% |
| Sarasota, FL |
-47% |
67% |
20% |
| Phoenix, AZ |
-48% |
67% |
19% |
| Miami, FL |
-46% |
64% |
18% |
| Las Vegas, NV |
-60% |
78% |
18% |
| Yuba City, CA |
-49% |
67% |
18% |
| Cape Coral, FL |
-50% |
67% |
16% |
| Port Lucie, FL |
-52% |
68% |
16% |
| Palm Bay, FL |
-47% |
62% |
15% |
| Salinas, CA |
-51% |
66% |
14% |
| Merced, CA |
-61% |
75% |
14% |
| Riverside, CA |
-49% |
62% |
14% |
| Daytona Beach, FL |
-49% |
57% |
8% |
Over time, our consistently good market has been fueled by limited building, a growing population, a strong and diverse economy and a location with a lifestyle where people want to live. Although I don’t expect that our market will continue to appreciate at it current pace, alas it is all a cycle, I do think that these factors will continue to make our market one of the most consistent in the nation. A great place to invest.