
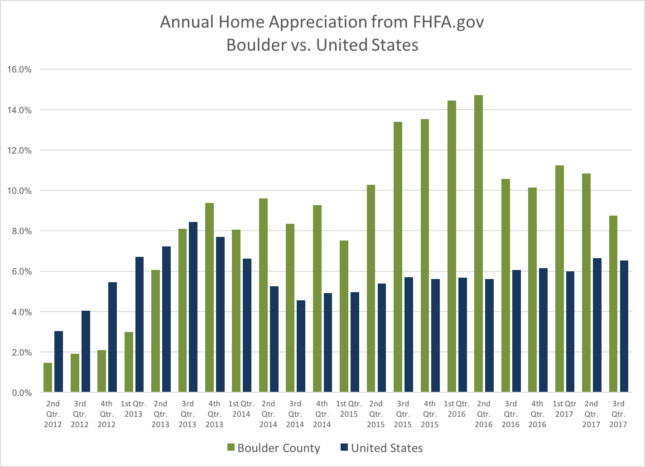
I began reporting in June that the market had shifted around Memorial Day. Since then, sales have declined when comparing same month closings. FHFA.gov recently released their quarterly “U.S. House Price Index” which reports on price appreciation in the 253 metropolitan areas in the United States. Looking at yearly appreciation, Boulder (the Boulder MSA includes all of Boulder County) shows an annual increase of 8.57% which is 57th best in the nation. Boulder County has been ranked in the top 20 each quarter since the 2nd quarter of 2015 so this recent ranking is a bit of a fall from the lofty perch we have recently been inhabiting. However, nearly 9% annual appreciation is still impressive and certainly above our historical average.
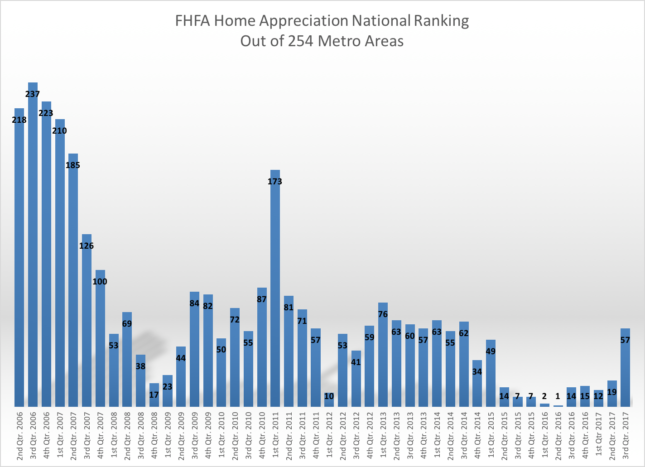
What was more concerning in the report was the appreciation rate for the 2nd quarter. The average home appreciation in Boulder County between July 1 and September 30th was a negative .59%. This is the first negative quarterly reading since 2nd quarter 2012, just before our market took off. This quarterly appreciation rakes us 12th from the bottom of the 253 markets. One quarter does not a trend make but it is something to watch and confirms the shift in the market. The first chart below shows the four quarter trailing annual appreciation for Boulder County and the United States. Over the past five years the cumulative appreciation has been 58.29%. The second chart below shows the ranking since 2006 (lower numbers show a better ranking).
Here are some other related articles that may give you some added context:
https://www.neilkearney.com/2017/09/05/summer-wrap-whats-next-boulder-real-estate-market/
https://www.neilkearney.com/2017/06/05/tracking-boulders-home-appreciation-time/

