The Boulder real estate market is back in full swing. The best indication of the great activity that is happening is that 35% of the homes on the market in Boulder County were under contract at the beginning of the month. This is a huge number! As you look at the graph below, you will see that 35% is far and away the highest percentage of homes under contract over the last four years. Buyers are having a hard time finding exactly what they are looking for and when a really good house comes on the market it is not uncommon to have multiple offers coming to the seller in short order. The numbers for the market are all positive but what is most important to me is how the market feels. To me, this market feels much different than it has since the 2005 – 2006 market. There is a buzz out there and the people who I run into are echoing the increase in confidence and activity. It feels like we have made an important turn in the market! Year-to-date sales are up 10%. I expect this to increase throughout the spring. Inventory continues to lag and this is contributing to the feeling of scarcity that buyers are feeling. The graph below compares the number of listings that have come on the market on a weekly basis over the past three years. Even though the market is moving in a very positive direction the number of new listings is lower than 2011 and 2010. The short slideshow below shows the rest of the pertinent sales statistics for the Boulder County real estate market. I have annotated the slides so the rest of the story is contained below.
I just checked. 25% of the houses on the market in Boulder County are under contract. Buyers are out there trolling for good homes and many are just not finding quite what they are looking for. There seems to be a shortage which is kind of strange in a market that has been kind of slow for a few years. So, I asked myself what is happening. The answer is very simple, not enough listings are coming on the market and more listings are being snapped up by buyers. Therefore there is a shortage.
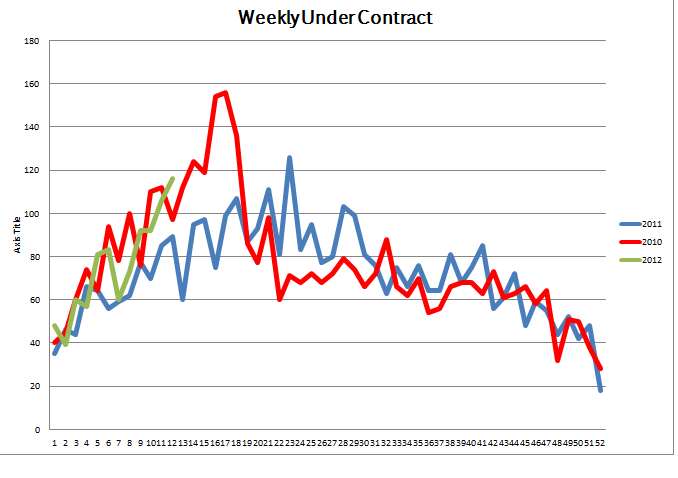
The following two graphs give a clear view of the situation. The green line is this year. The red line is 2010 and the blue line is last year. The first graph shows new listings over the last three years. This is the most active year for sales so far but we have the fewest new listings. The second graph shows the number of homes that have gone under contract on a weekly basis and shows that the activity is much more robust than a year ago and similar to 2010 during the last few months of the tax credit.
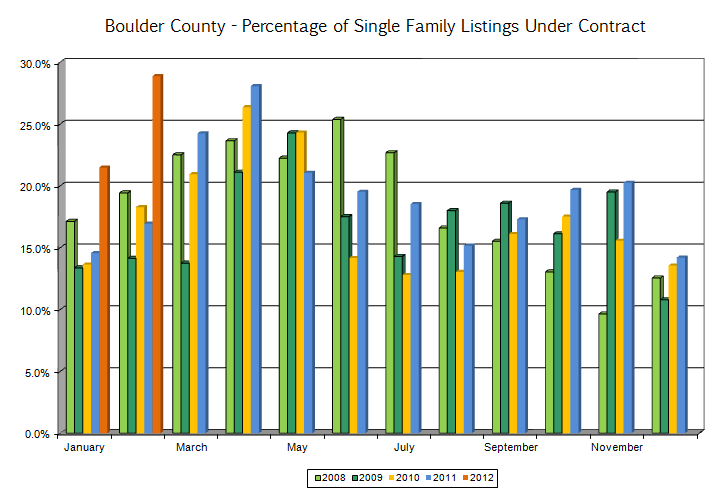
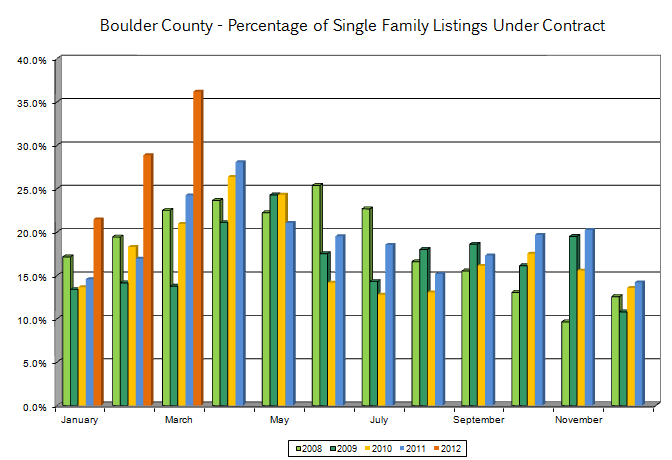
The quick answer is that the supply of new homes in the Boulder area isn’t meeting the demand right now. At the beginning of every month I run some comparative statistics and this month the results were very illustrative. The chart below shows the percentage of listings that are under contract by month from 2008 forward. Each grouping shows the under contract percentage taken on the same day of each year. Look at the big orange bar near the left side. That represents the highest percentage of homes under contract over the past five.
The next chart shows the total number of residential homes on the market in Boulder County. We are nearly at the lowest inventory level for any month over the past five years. Put these two conditions together (high demand, shortage in supply) and we have ourselves a pretty active market.
The next two graphs show activity over the past three years on a weekly basis. The first graph shows the number of homes that have been listed. We are on a lower pace of new listings than either of the past two years.
This last graph compares the number of homes that have gone under contract on a weekly basis over the past three years. It shows a much stronger market so far than we had just a year ago.
If you are looking to dip your toe into the Boulder real estate market you will need a good guide. I have been helping people find just the right place to buy and helping sellers successfully market their homes for 20 years. I’d love to put my tools to work for you.
I’m pleased to present The Kearney Report. This is a broad look at the greater Boulder real estate market over the past year. I write a lot about market statistics and trends but this report sums it all up and shows trends in the market over time. A full description is included in the report so I encourage you to read it below. I compile the information included in the report from market data mostly from the IRES MLS system. I have done my best to present a detailed and accurate report using good sources. Please contact me if you are contemplating a real estate transaction so that I can interpret these results and create a customized report for your home and your specific area.
The thing about statistics is that the only good data looks backward. Any forward looking statistic is just a prediction, a forecast, a guess. As I have written about recently, the real estate market in the Boulder area is full of buyers right now. Unfortunately for the buyers, there are not that many listings to choose from. As I write this nearly 1/3 of homes listed for sale already have been matched with a buyer. Real Estate is basically a complex supply and demand problem. Right now the supply isn’t enough to meet the demand. If that persists then the prices should increase.
Over the past few years the number of sales has declined. In other words, the number of ready, willing and able buyers has declined. As demand falls, all things being equal, prices should fall. Luckily for us, the supply of homes has declined as well lessening the effect on home prices. Over the past few years median prices have fallen in Boulder County. Not nearly as severe as most other areas but there has been a small correction.
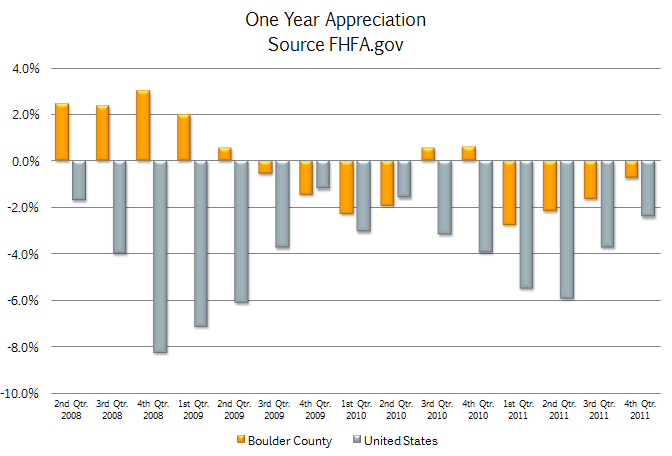
One of the best data sources for home appreciation numbers is FHFA.gov. This governmental agency tracks home values across the country using conventional loan data. It then produces a report which ranks each area against the other 306 areas it tracks. According to FHFA, Boulder County homes over the past year (ending December 31, 2011) have lost .75% in value. Not even a 1% decline. This ranks 57th nationally. Top 20%. Not bad.
For the fourth quarter our appreciation was a positive .63%. This ranked 98th nationally. The good news here is that even as our appreciation improved it ranked worse. This means that there is a broad recovery happening around the United States.
Note1: Fort Collins/Loveland ranked 6th nationally with a 1.49% increase for the year.
Note 2: The five year combined appreciation for Boulder County is + 1.56%.
Chart 1: Comparison of Boulder County home appreciation to U.S. average.
Chart 2: National ranking of Boulder’s appreciation. (lower is better)

 The numbers for the market are all positive but what is most important to me is how the market feels. To me, this market feels much different than it has since the 2005 – 2006 market. There is a buzz out there and the people who I run into are echoing the increase in confidence and activity. It feels like we have made an important turn in the market! Year-to-date sales are up 10%. I expect this to increase throughout the spring. Inventory continues to lag and this is contributing to the feeling of scarcity that buyers are feeling. The graph below compares the number of listings that have come on the market on a weekly basis over the past three years. Even though the market is moving in a very positive direction the number of new listings is lower than 2011 and 2010.
  The short slideshow below shows the rest of the pertinent sales statistics for the Boulder County real estate market. I have annotated the slides so the rest of the story is contained below.