by Neil Kearney | Sep 19, 2018 | Boulder County Housing Trends, Statistics
When someone asks me about the real estate market most of the time they are really asking about price appreciation. Are prices rising? Those who already own are cheering for it to continue and for those who don’t yet own they feel small beads of sweat starting to rise on the back of their necks as they continue to see the market moving away faster than they can catch up.
Home price appreciation in Boulder County has been notably strong and consistent over time. According to FHFA.gov, a home that was purchased in January of 1992 (this is when I began selling real estate in Boulder) is now worth $961,702. A 380% increase! More impressive is the stability of that growth (Boulder County is the #1 housing market in the US for growth and stability according to SmartAsset.com). In the spring of 2016 our market was the top ranked market in the U.S. for home appreciation with 14.72% for the year and 4.9% for the second quarter alone. Two years later our market has slowed a bit. No longer are houses being mobbed by would be home buyers the first day, racing to compete with 8 other home buyers. Our market has moved a bit closer to balanced.
The most recent quarterly data from FHFA.gov shows that we are ranked 65th in the nation in terms of annual appreciation with 8.76% (still a very strong number!). What was most interesting to me was that 4.77% of that appreciation took place in the second quarter alone. This ranks 21st best in the U.S. This tells me that the buyer’s demand in our area, although a bit subdued is still plenty strong to absorb the available inventory and push the prices up. In my opinion, since the end of June our market hasn’t kept up this pace of appreciation but I may be surprised when the numbers for the third quarter come out in a few months.
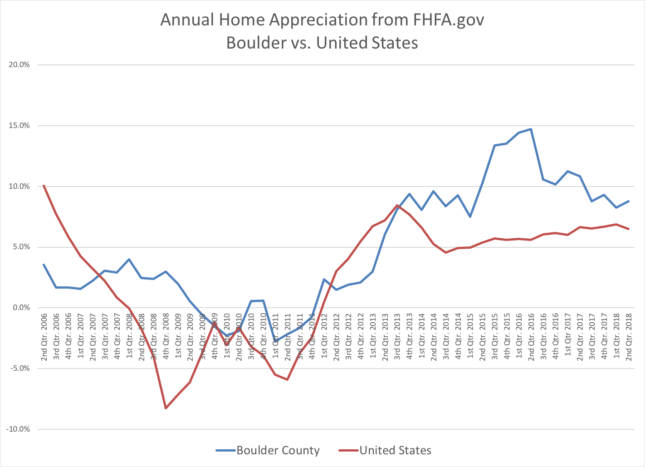
This first graph shows the annual appreciation on quarterly basis for the United States (red) and Boulder County (blue). What stands out to me is what a great investment Boulder real estate has been. A good stock portfolio has been described as one that exceeds the market average in a good market, and goes down less than the market in a bad market. That is exactly what we have seen in our area over the past cycle.
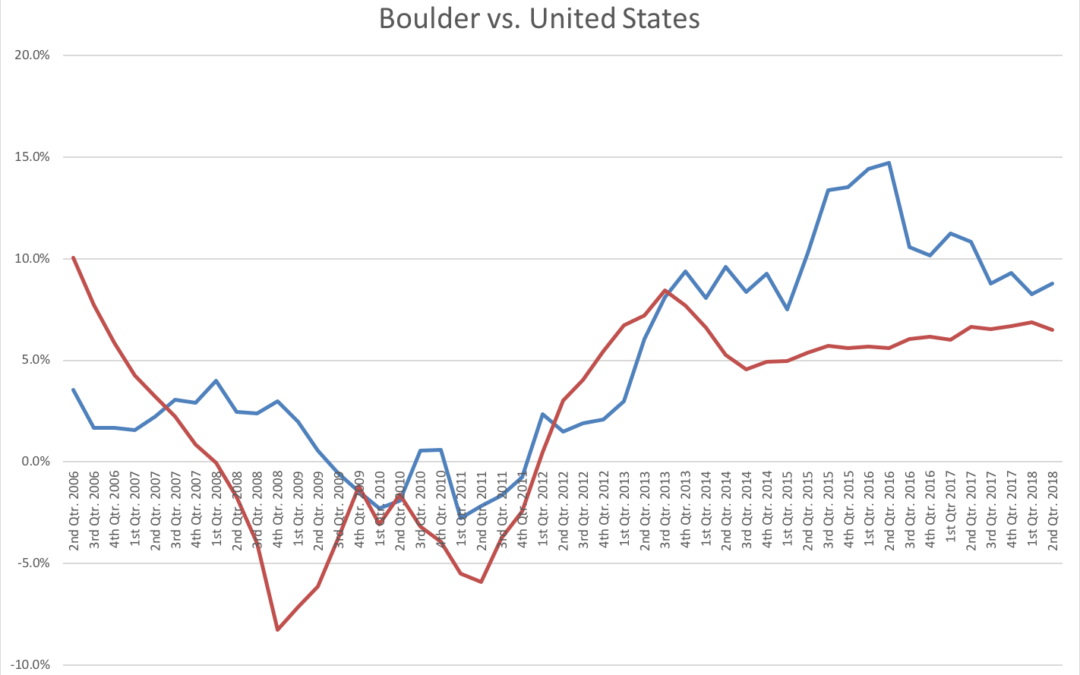
The second graph (below) shows how Boulder has compared to the other 245 Metropolitan Statistical Areas around the United States. A low number shows that we are near the top of that ranking and a higher number show we are near the bottom. As I mentioned earlier, right now we are ranked at 65th.

by Neil Kearney | Sep 19, 2018 | Uncategorized
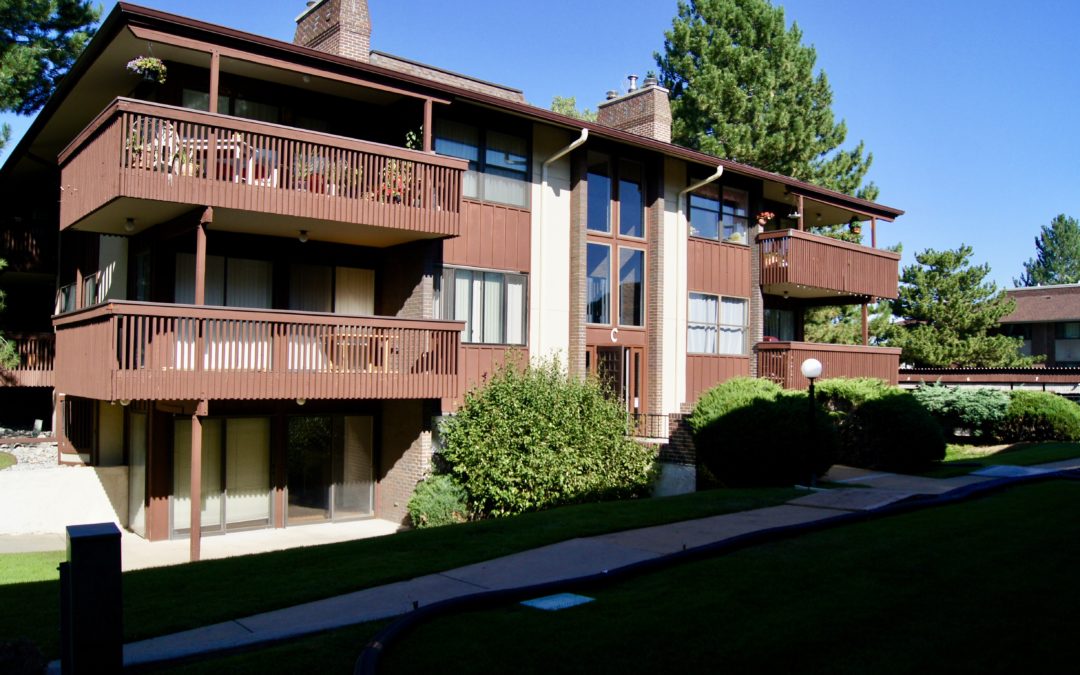
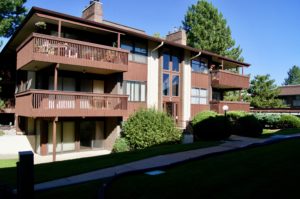
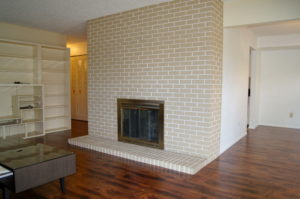
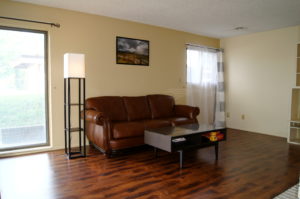
You will love the updates of this bright and large east Boulder garden level condo. Inside you will find extensive wood flooring, updated kitchen, two bedrooms and two full baths. Also included are, in unit full sized washer and dryer, a carport space, extra storage and a nice patio area. Great location near Manhattan Middle School and the East Boulder Recreation Center. Easy access to shopping and transportation and to CU by bus or car.


by Neil Kearney | Sep 7, 2018 | Boulder County Housing Trends, Statistics
The real estate market has been fairly strong this year. Not off the charts like 2016 and a bit subdued by the low inventory of available listings, but strong nonetheless. Sales through August are down 2.5% from a year ago, not much of a change. However, we are seeing fewer listings, fewer multiple offer situations and more listings staying on the market longer. These are the bigger story. When you compare YTD sales to 2015 we are behind by 17%. If you look at the inventory numbers from 2015 you will see that they are much higher than now. More listings mean choices for buyers and end up in more transactions. Fewer listings in a strong market almost guarantee high appreciation. And we continue to see prices rise, although that seems to be at a slowing pace.
As always, this time of year is an important one. It is common that after the spring surge of activity that there is a summer slow down. We usually see the market pick up again in the fall. And we usually see that happen right after Labor Day. Let’s see what happens.
For more detailed statistics and analysis take a look at the embedded slide presentation below.

by Neil Kearney | Jul 30, 2018 | Colorado Lifestyle
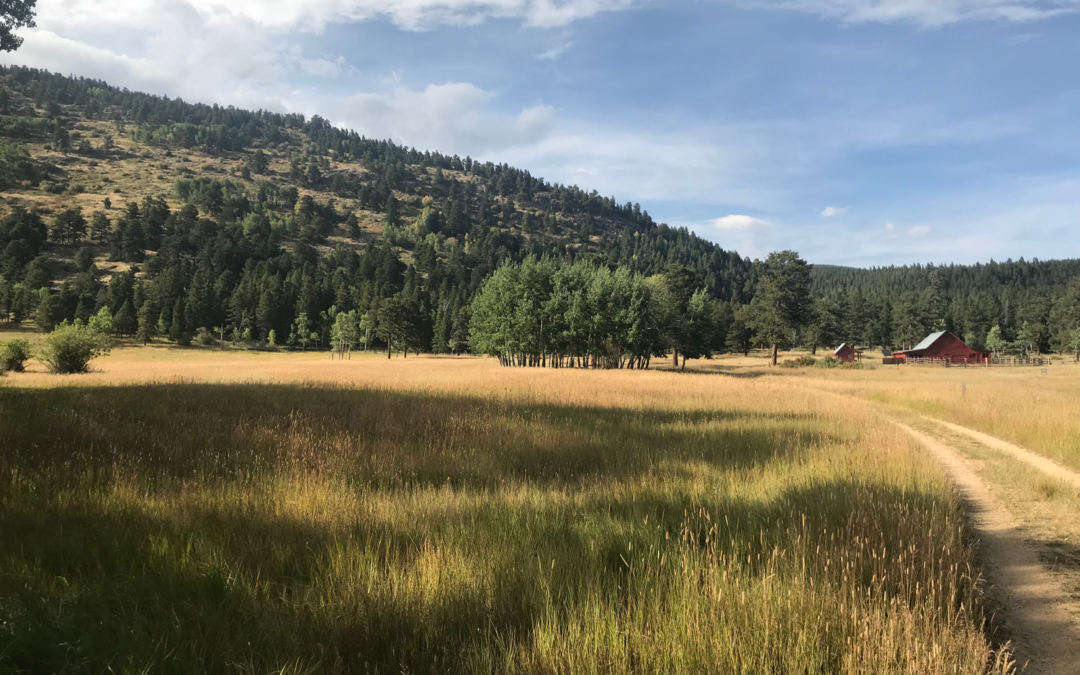
 I grew up in Boulder and I live in Boulder. Boulder is a special place. People are moving to Boulder because of the unique lifestyle that is available here. A great climate, an active lifestyle, world class dining and cultural and sporting events right in town. To that end I love supporting the community in what makes it unique and special. This year, I am proud to be a presenting sponsor for the Colorado Music Festival. with concerts held at Chautauqua Auditorium. I remember fondly my first concert at this historic and beautiful auditorium, and looking at the twilight sky out from my seat through the gaps in the siding planks gives me a visceral feeling of summer in Boulder.
I’m grateful to be a part of this community and I’m grateful to give back to the community that supports me. The specific concert I’m sponsoring is Thursday August 2nd and features the music of Bernstein – Dvořák – Bartók with Conductor: Peter Oundjian and Guest Artist: Narek Hakhnazaryan on the cello. If you can make it on Thursday you can use the code corp2018 to get a 20% discount. Here is where you buy tickets online.
Here are some other local organizations that I support: Emergency Family Assistance, Imagine Foundation, Attention Homes
by Neil Kearney | Jul 23, 2018 | Boulder County Housing Trends, Statistics
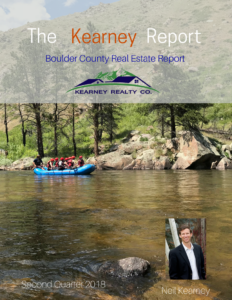 The Kearney Report – Second Quarter 2018
Click this link to view the report – The Kearney Report 2nd Quarter 2018
During the second quarter of 2018 the Boulder area real estate market continued to be a strong seller’s market.
During the second quarter of 2018 there were 1,452 sales in Boulder County which is roughly the same as it was a year ago. The median sales price during the quarter was $535,550 which is 7.1% higher than it was a year ago during the same time frame. Inventory this year has not improved. A trend of fewer homes on the market has continued to keep the pressure on buyers to act quickly and pay top dollar for homes.
Overall the market is good! We again had a very active spring market. Overall sales are down 3% from a year ago. Homes are still selling quickly but there have been fewer multiple offers. When there have been multiple offers the premiums paid are not quite as high (3.5% rather that over 4% on average). This is the time of year when we see some slowing prior to school starting. Here are some graphs that show the trends in the market.
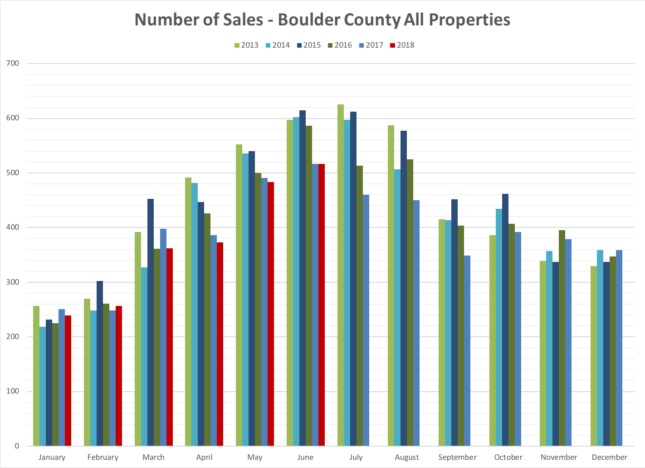
This first graph shows residential sales in Boulder County by month over the past five years. Red bars indicate 2018 sales. Like all other years we are following the basic pattern of sales that peaks in June or July and then tapers off. Subtract 30-45 days for when the contracts were actually written.
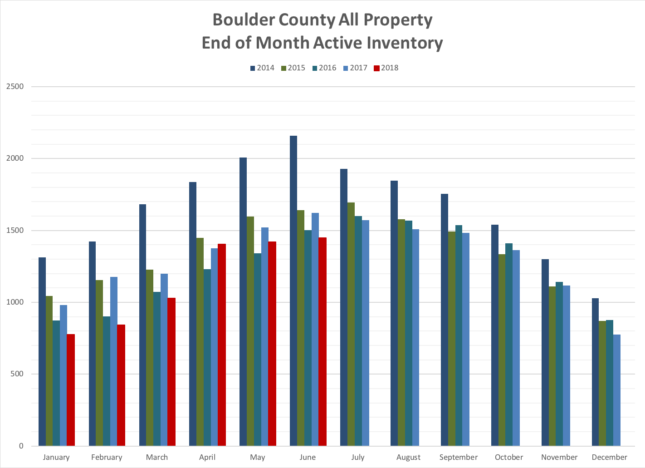
The second graph shows the inventory of active homes at the end of each month over the past five years. 2014 (the tall bar) shows a historical more normal level for active homes. Our low inventory over the past four years corresponds directly to very high appreciation. Low inventory also inhibits sales because there are a large number of buyers trolling around waiting for “the house” to come on the market.
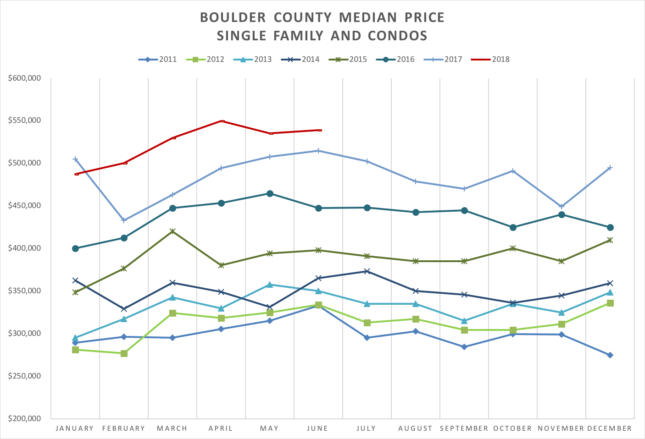
The graph below shows median prices by month over the past over the past eight years. The steady growth looks like a layer cake with each year higher than the one before. In summary, inventory continues to be low, sales are similar to where they were a year ago and prices continue to rise. Enjoy the report!