Overview
2018 was another strong year for the Boulder area real estate market. During the first half of the year, the combination of low inventory and strong demand extended the “sellers market” that we have been experiencing since mid 2012. However, even in the spring, we saw fewer multiple offer situations and fewer overall showings. During late summer, the market began to show signs of weakness. We saw more price reductions, it took longer for homes to go under contract, there was more negotiation favoring the buyer and overall sales (compared to the previous year) began to fall. During the fourth quarter, sales were down 12% compared to the previous year and during December sales were 18% lower than they were for the same time period in 2017.
Here are some of the key statistics for Boulder County real estate in 2018:
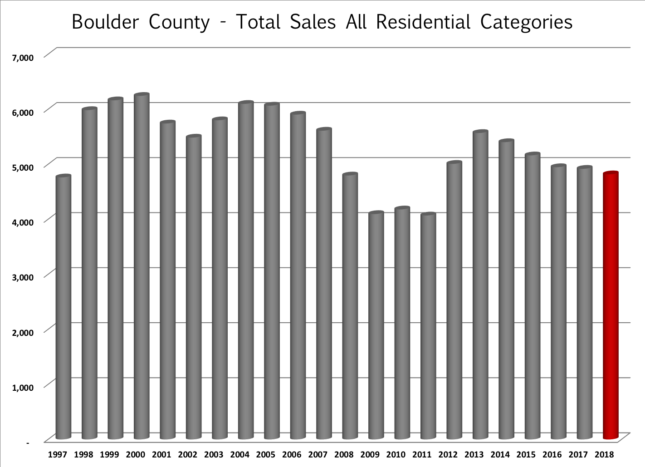
- Total sales were down 4.7% to 4,459 sales. Down 17% from 2015. (See first large graph below)
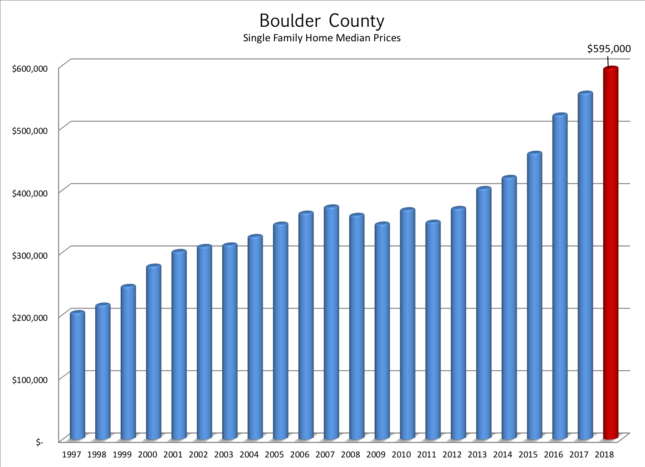
- The median price for all sales in 2018 was $520,000 which is up 8% from 2017. (See second large graph below)
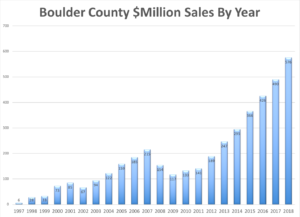 There were 576 sales that exceeded $1 million during the year which is 86 more than a year ago. Not surprisingly, an all time record! See the graph on this page to see the steady climb of + $1 million sales. There are two factors at work here. First is the cumulative price appreciation. Second is the improvement in the housing stock. There are many new homes and many significantly remodeled homes which make comparing the present sales to those a decade ago similar to comparing oranges to tangerines. (See inset graph to the right)
- At the end of December there were just 885 properties on the market in Boulder County and 328 of those were already under contract. This is more than we had on the market a year ago, but much lower than historical averages.
- Average days to offer – 32 (Equal to 2017)
- Average negotiation off of list price 1.14% (1.29% in 2017)
- 32% of properties sold for a price above the list price. The average premium paid for these sales was 3.3%
- 45% of properties sold for a price below list price. The average discount on these sales was 3.2%.
Over the past 10 years, owning real estate in Boulder County has been a great investment! Cumulative appreciation since 2008 has exceeded 60% with most of that occurring during the last six years.
What Caused the Slowdown during the Fourth Quarter?
Affordability – We are 6 ½ years into an unprecedented bull market. While we haven’t yet peaked, there are more and more signs that the market is slowing down. The main factor buyers look at when they consider a house is “can I afford it?”. There are three parts to this answer; price, income and interest rates.
Prices are up over 60% over the past five years. Homes were certainly more affordable five years ago, but crying over spilled milk doesn’t help a new resident to the area. The question is “can I afford it?”.
Incomes in Colorado have increased on average 5.2% over the past five years.[1] Helpful towards affordability, but with a lower baseline potential buyers are losing ground to prices nonetheless.
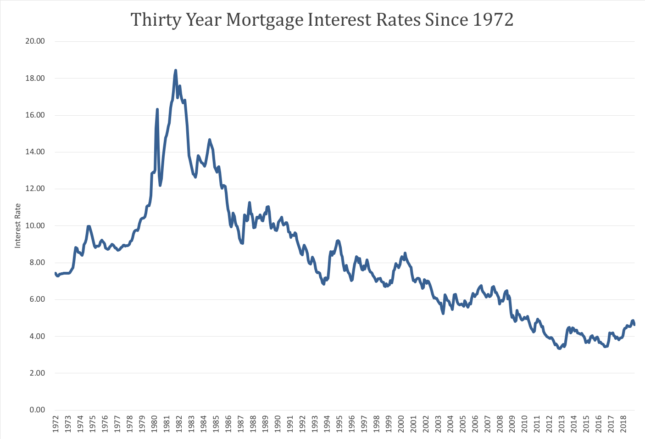
Interest rates have been the saving grace for buyers since 2012. 30 year mortgages in the 3’s and 4’s have made home buying (especially as rents have increased) affordable. But as prices have risen and now as interest rates have increased (see graph below) buyers are finding affordability more of an issue.
Wealth Effect – According to a Daily Camera article in 2015, 36% of sales in Boulder County were all cash transactions. I suspect we were in that range again last year. We are seeing a huge influx of people coming to Boulder to telecommute or to retire. Those who are choosing Boulder for the lifestyle have cash to spend. The stock market is in the midst of the longest bull market in history. When a correction takes place as it did in the fourth quarter, investors tend to 1) ride out the correction and wait for improvement to their “new normal” and 2) feel less wealthy and therefore delay non-essential purchases. It seems that we may have seen some of these effects locally as the S&P 500 decreased by 14% during the last three months of the year.
Supply and Demand – What to look for…
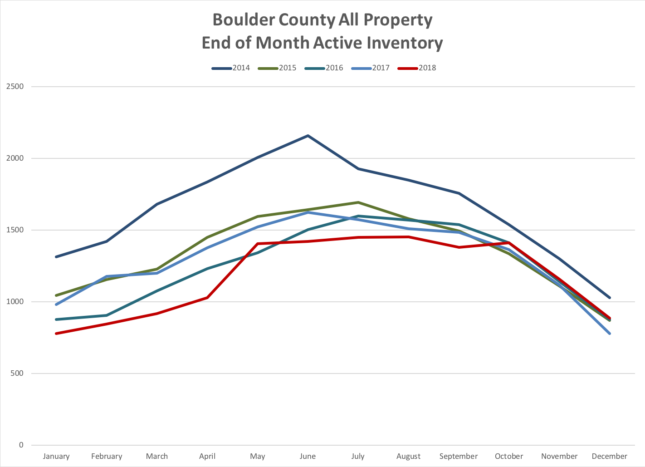
When looking at the local real estate market supply comes from two sources – people who list their homes for sale and new construction. Since the economic crisis in the late 2000’s, the flow of homes to the resale market has decreased consistently. I have monthly data going back to 2014 and the number of homes on the market in 2018 is over 30% lower than it was in 2014. (see graph below) Historical inventory is even higher than 2014. To exasperate this even further, with the strong market, at any given time 40% – 50% of the active listings are already under contract. When supply at such low levels, buyers face more competition from other homebuyers and prices tend to increase. In order for the market to shift from a seller’s market to a buyer’s market inventory will need to rise and we haven’t yet seen that happen.
The demand for homes is based upon new people moving to the area. Colorado has been one of the top states in the nation when it comes to net migration. People are moving here for the lifestyle and the jobs. In Colorado there were 65,000 new jobs created in 2018. These new jobs attracted 46,059 new residents to the state. Over the next seven years the State Demographic Office has predicted that Colorado will see 600,000 new residents.[2] Each of those new households will need housing.
Market inventory is a statistic that gives an indication as to the balance between supply and demand. Simply put, it measures how long it would take to sell all of the listings in a given area if the sales flow would remain constant and no new listings would come on the market. A balanced market is around 5 – 6 months. Anything shorter is a seller’s market and anything longer is a buyer’s market. At the end of December the inventory in Boulder County was 2.23 months, still a strong seller’s market. It’s interesting to see how this inventory statistic increases across the price ranges.
- Up to $500,000 – 1.9 months
- $500,000 – $1 million – 2.6 months
- $1 million to $2 million – 3.4 months
- Above $2 million – 8.9 months (buyer’s market)
After a long time of low production and inventory, new home builders seem to be catching up. Over the past half-decade we have seen many thousands of apartment units built. These have provided housing for many of the new residents. Recently, vacancy rates have increased and rents have decreased a bit. Single family home permits were up 13% and new home sales were up 9% for the year through the third quarter.[3]
Looking Ahead
After a slow fourth quarter, the spring market will be especially indicative about the direction of the market. As discussed earlier, there is still demand and low inventory, so I don’t expect a big shift in the market. However, it seems that the rate of appreciation is slowing and that continued rising interest rates will have a negative effect. I expect sales to decrease slightly and for prices to increase again but more slowly. This should continue until we start to see increases in inventory.
[1] 2019 Colorado Business Economic Outlook – CU Leeds School of Business
[2] IBID
[3] IBID


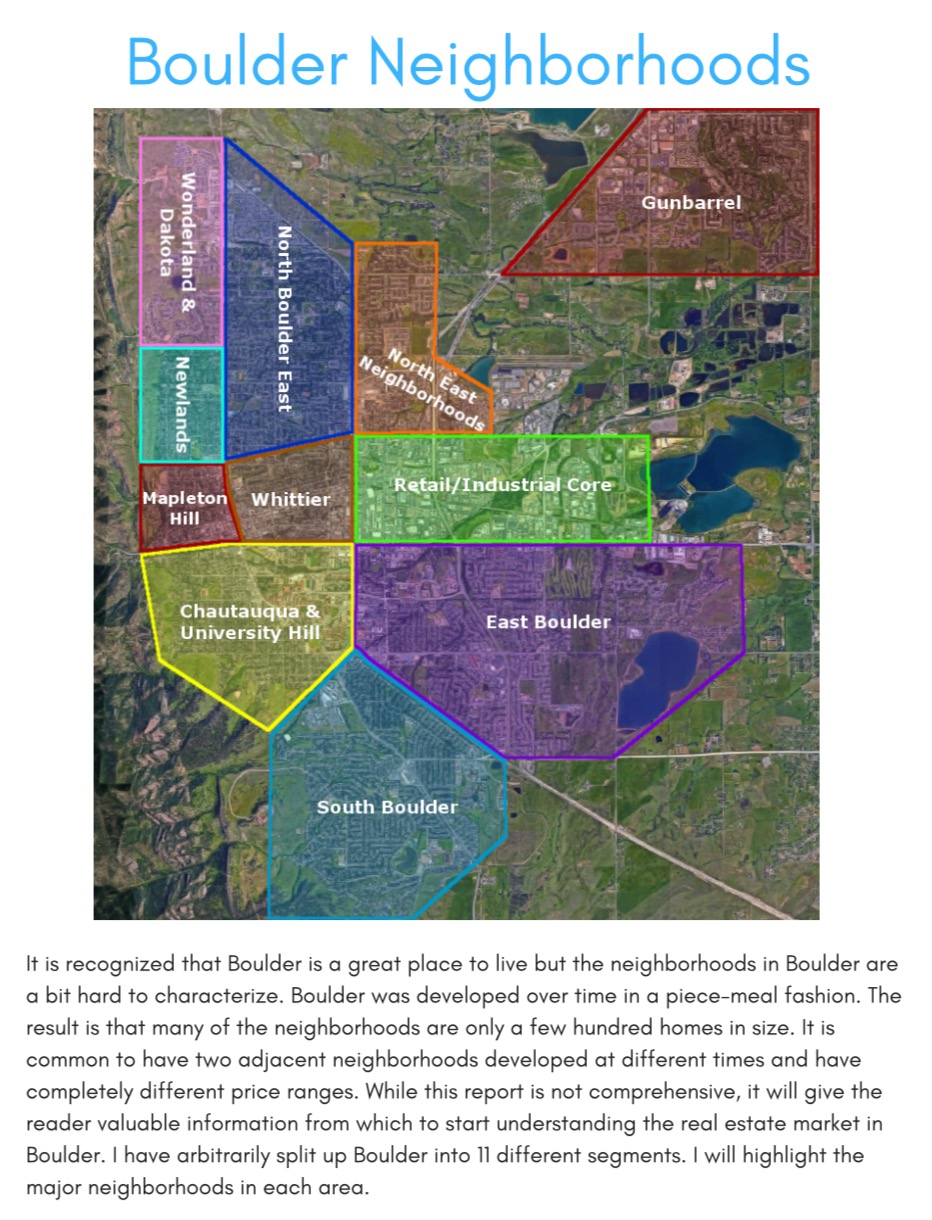
 I realized a few years ago that people coming from out of town were having a hard time making sense of the different neighborhoods within Boulder. In response, I created The Boulder Neighborhood Guide. In this report I have split Boulder into eleven different areas and present the lifestyle highlights, schools, shopping districts, local recreation, basic real estate statistics and a sample of sales from the previous year for each area. If you’re interested in learning more about the different neighborhoods within the City of Boulder this may be helpful.