In order to sell a house in today’s real estate market a house must make a compelling case to the market. Some things like neighborhood and location within the neighborhood you can’t control. But set those aside and you are left with two key variables that are controllable and important to the sale.
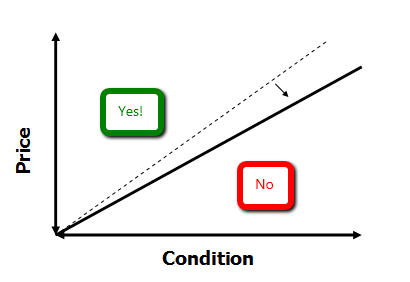
What I’d like to talk about today is being competitive in the market. The main variables a seller has control over is the price they ask for their home and condition and/or upgrades of the home. I have represented these two variables on an axis below so that I show you what I’m thinking. Basically, if your home is in great condition (and I mean exceptional) you can ask a high price compared to similar homes on the market. If your home is in poor shape you have to ask a lower price. This is not rocket science but it gets trickier when a house is somewhere between the extremes. It is in okay condition and has a middle of the road price. Looking at the chart below you can see the line running at 45 degrees. Think of this as the success line. Every house that fits above the line (price vs. condition) will most likely end up in a successful sale. Every home below the line will wallow until the price or the condition changes enough to get it above the line.
Right now the market is fairly slow. There are fewer buyers out there. This means that competition for sellers is tough. In order to be compelling to the small pool of buyers they have to bring a more compelling product to the market. This means that the line has shifted, sellers have to either improve their home to sell it for the same price or reduce their price to make it work.
Knowing where you are is the tricky part. I help my clients by giving good feedback and keeping them abreast of the market as it changes. The information you used to list your house is no longer valid. Get it priced right and have your house show the best it can. If you can’t afford to make improvements up front, lower your price. It’s simple economics.
A Gallup poll on overall well being has named Boulder as the number 1 city in the United States! The index is based on the polling of 365,000 US citizens a year since 2008. The video above is a CBS Sunday Morning feature on Boulder, the number 1 town for overall happiness and Huntington West Virginia which came in last in the index. The video features a true local and an old friend Dave Query.
The index includes health statistics and hard to measure happiness or optimism statistics. The overall score for Boulder was 73.7 a full point above Lincoln Nebraska and Ft. Collins Colorado. It’s hard to say what is so special about Boulder but this starts to quantify it. Ready to move here? There is room for a few more. Give me a call and we can get started.
I was helping my son this past weekend with a school project about our family ancestry and came across this interesting photo. The photo shows my great grandfather, Adrian Fletcher Kearney in front of a real estate office. My guess is that the photo is about 90 years old but I could be off. I didn’t know that he had any connection with real estate but by this photo, it looks like he did. Here is what I know about him. He was an attorney and the superintendent of schools in Maquoketa Iowa from the late 1800’s up until about 1920. That is when my grandfather enrolled at the University of Minnesota. Soon after enrolling the entire Kearney family moved to Minneapolis to keep an eye on my grandfather. This time frame is when this photo could have been taken. As many of you know, both of my parents were (are) Realtors in Boulder. I knew it ran in the family, but I didn’t know it went back this far.
You have probably seen the attached picture before – is it a picture of a young women or an old women? The answer is it depends on how you are looking at it. How you perceive it.
One definition of reality is: “all of your experiences that determine how things appear to you”. I agree with this on many levels – I believe you make your own reality and what you know and believe as well as your past experiences effect what is “real” for you. A slum dweller in India has a much different reality than a socialite living in Beverly Hills.
The key word in the definition above is experiences. I submit that this definition is not as true as it once was. Don’t worry, I will tie in to real estate in a moment.
In the past (B.C. through the 19th century), reality was based on what one actually experienced. All inputs to opinion were very localized. For example, when there was a famine, chances were that you were hungry. Perceived reality equaled actual reality. There were no outside forces to sway your perception.
During the last century, technology in all of its forms have provided us a wider set of inputs. I guess this is called globalization. We have access to and know more about more subjects. Where we used to just be concerned with our local experience, we now are fed data on an ever-broadening spectrum of subjects. Google (verb) whatever subject you can imagine and have instant access to other’s research and opinion’s. It is no longer our own experiences that form our perceived reality it is the experiences and knowledge of others.
My point is that our perceived reality may not always equal our actual reality due to the influence of non-localized information. I run into people all the time who can’t believe the sorry state of our real estate market. The problem is that they have no actual experience with the market, their perceptions are based on outside information. When people come in from out-of-town, (or locals who have not been paying attention to the trends) they assume that values have dropped at least 20%. When in fact they have remained relatively stable over the past 5 years. They come from that paradigm when they submit very low offers. It is easy for sellers to realize that these low ball offers do not fit with the market.
Right now, the media has plenty of negative news to report. There is blood in the water and the sharks are in a frenzy. Foreclosure’s in CA, value loss in Michigan, empty buildings in Florida, etc. Bad news all around, a fact. The problem is that people take that news and equate that news to all other areas. The message is that the market is bad, the conclusion is that the market is bad everywhere.
I get asked all the time what a reasonable offer would be. My answer depends upon many factors but hard data also helps bring a good perspective to the negotiations. Over the last year in Boulder County, real estate transactions have had the following average negotiation percentages in each price range:
$0 – $250k 3.15% (1,307)
$250 – $500k 2.95% (1,550)
$500 – $750k 3.99% (498)
$750 – $1 MM 5.24% (141)
$1 – 1.25MM 8.2% (58)
$1.25 – $1.5MM 8.35% (35)
$1.5 – $2MM 9.9% (22)
>$2MM 8.65% (23)
Numbers in parenthesis represent the number of sales in that price range.
Perception does not always equal reality. While the market in Boulder County is not stellar, it is much better than what you would think by listening to the news. Prices are holding, properties are selling and foreclosures are not a big part of our market. We are very lucky and I’m spreading the word! When you are ready to buy or sell give me a call. I’m here to help. Neil 303-818-4055
On a consistent basis the number of homes that are added to the MLS as new listings far outnumbers the number of sales. In fact, so far this year there have been 7,199 new residential listings added to the IRES MLS system in Boulder County. During that same time 3,453 properties have sold.
So what happened to the 3,746 other properties that came on the market but have not yet sold? Ont he chart above this number is represented by the gap between the red and the blue. The most logical answer is that those properties are still on the market. Right now there are 2,269 properties on the market. So at first glance this would account for over half. But remember that we don’t start the year with a blank slate. On January 1, 2010 there were 2,191 listings on the market so actually we have just accounted for 78 of the 3,746 listings. So where did they all go?
Here are the scenarios I can think of:
Withdrawn – Sellers get tired of selling. They realize that their property at the price they want/need is not working so they withdraw it from the market and wait for a better day. So far this year there have been 3,103 properties withdrawn.
Expired – Listing agreements between a Seller and Realtor last a finite amount of time. If the property has not sold by the end of the agreement then the listing automatically is deleted from the system. So far there have been 550 expired listings.
So the math so far:
2,191 starting inventory
+7,199 new listings
-3,453 sold listings
-3,103 withdrawn listings
-550 expired listings
= 2,284 (Actually the exact number of active listings is 2,269.)
I’m a bit surprised. I was expecting this number to be way off and I was going to spend this paragraph talking about why the numbers don’t add up. So on to plan B. Despite the good math (less than 1% error), there is some fuzziness in the numbers. Not every new listing is a “brand new” listing. A Realtor can withdraw their listing and enter it again anew minutes later. In a competitive market this happens, more often than you think. Also, not all sold listings, withdrawn listings and expired listings were listed this year. The numbers are not as straight forward as they seem.
So why am I debunking my numbers after I just proved the math to be accurate to less than 1%? It’s because you need to realize that the numbers don’t always give the full picture. There is more to it than looking at some statistics you have to know what is going on to have the full picture. After selling real estate in Boulder since January 1992 I have developed a sixth sense of how the market is. Right now the numbers don’t seem that great but I see more promise than I did two years ago at this time. Let me know how I can be of service.