by Neil Kearney | Jul 6, 2017 | General Real Estate Advice, Real Estate 101
 With property values increasing as steadily and as rapidly as they are in Boulder County, it should come at no surprise that property taxes are following suit. This became very clear this past May when assessment notices made their way around town informing Boulder County residents that the assessed value of their property had significantly increased by on average 26%. Although it is exciting to watch the value of your assets increase it does mean that property taxes will most likely increase for you as well.
When discussing property taxes I believe it is helpful for anyone to have a basic understanding or concept of how property taxes are actually determined. When boiled down to the basics it is actually quite easy to understand.
Three major components go into your property taxes:
- Rate of Assessment
- Assessed Value
- Mill Levy (Tax Rate)
The Rate of Assessment for residential properties in Colorado serves as the base for property taxes as it determines what percentage of your homes actual value can or will be taxed. This can be adjusted on the state level and just recently got lowered for the first time in 14 years from 7.96% to 7.2%. The rate of assessment is multiplied by the assessed value to your taxable value. The Assessed Value is the value assigned to your home by the county assessor. This assessment is adjusted every two years based upon comparable sales in your neighborhood. The assessed value is what arrived in your mailbox in May. Finally, the Mill Levy (also known as the Tax Rate) is the percentage of the Assessed Value that is actually taxed and collected by the county on a yearly basis. The Mill Levy is set every fall and sets the amount and allocation so that the budgets for schools, emergency services, roads, etc. are met.
 As taxes rise, one tax exemption that may be important for you or your family members to know of is the Senior Property Tax Exemption. With the deadline of July 15th rapidly approaching it can be helpful to understand what this exemption is, how much it could save you, and of course if you are eligible. Those that are eligible for the Senior Property Tax Exemption will receive a 50% property tax deduction on the first $200,000 of the properties value equating to between $550 and $760 of property tax savings per year.
Am I eligible for this exemption?
You are eligible if you meet all three of the following requirements:
- You Were born on or before January 1, 1952
- You have continuously lived in the home starting before January 1st, 2007
- You have continuously owned the home starting before January 1st, 2007
If you happen to meet all three of the requirements and file your application before July 15th, 2017 you will first see the discount on your tax bill in January of 2018. There is no need to reapply each year as the exemption will continuously stay active as long as no disqualifying event occurs.
To see more information on the exemption or to fill out the application go to: https://www.bouldercounty.org/property-and-land/assessor/senior-exemption/

by Neil Kearney | Jun 27, 2017 | For Buyers, For Sellers, General Real Estate Advice, Real Estate 101
 This past May, Zillow, the online real estate search company was sued by a Chicago based home building company who claimed that Zillow’s online Automated Value Model (AVM) is deceiving home buyers with prices below the true value of properties leading to frustrated sellers. Furthermore the suit claims that Zillow’s “Zestimates” are in violation of the legal description of an appraisal, which under Illinois law must be administered by a licensed appraiser. Zillow defends themselves by stating that their Zestimates claim only to be approximations not true appraisals; to which the suit responds stating that whether or not they are technically appraisals homeowners are viewing them as such leading to confusion and irritation. It will be interesting to see over the coming months how this lawsuit plays out. It’s clear that Zillow’s Zestimate and other AVM’s which are becoming common across the internet are being used by consumers to determine the approximate value of their home. But in my experience, many times this approximation isn’t close to the true market value.
So just how accurate are Zestimates. In a Nationwide study conducted by Zillow it was found that their Zestimates fall within 5% of the sales price of homes 53.9% of the time, within 10% of the sales price 75.6% of the time and finally within 20% of the sales price 89.7% of the time. Back in 2007 when Zillow was just getting its footing I conducted my own research local to Boulder on the subject and found that on a whole Zillow’s algorithm was 99% accurate. However, when I took a closer look I found that there was an 18.4% standard deviation. Additionally, the outliers were up to 50% off. Although Zestimates generally do a good job when looking over a large pool of properties, their approximation for any specific property within that pool can many times be significantly off of the true value.
To read my 2007 article click here.
With home values rising as fast as they are in Boulder and with Automated Value Models such as “Zestimates” readily available, inexpensive and simple to use, it’s easy to understand why so many consumers gravitate towards them. It’s important to remember though that the very nature of AVM’s being automated hinder their ability to provide an accurate evaluation of properties all of the time. AVM’s fail to take into account many critical and influential aspects of a property that can greatly affect the value such as the current condition, recent upgrades (or the lack thereof), actual square footage, views and other details. After understanding these substantial flaws it becomes clear why AVM’s, including Zestimates often over or undervalue homes leading to users feeling mislead.
AVM’s have their place as a non-binding general view of the market when you are not considering a transaction. It’s fun to look. However, when you are considering a real estate transaction you need to bring in an experienced professional to give you a more accurate comparative market evaluation. Experienced Reatlor’s like myself can give you the broad information and experience necessary to make decisions around. If you are considering a move I would be happy to come by and give you an individual market analysis.
To read more about the case go to: http://www.marketwatch.com/story/do-zillow-zestimates-mislead-home-buyers-illinois-lawsuit-claims-yes-2017-05-22
by Neil Kearney | Jun 5, 2017 | Boulder County Housing Trends, Statistics
Boulder County Has One of the Most Consistently Strong Real Estate Markets In The Nation
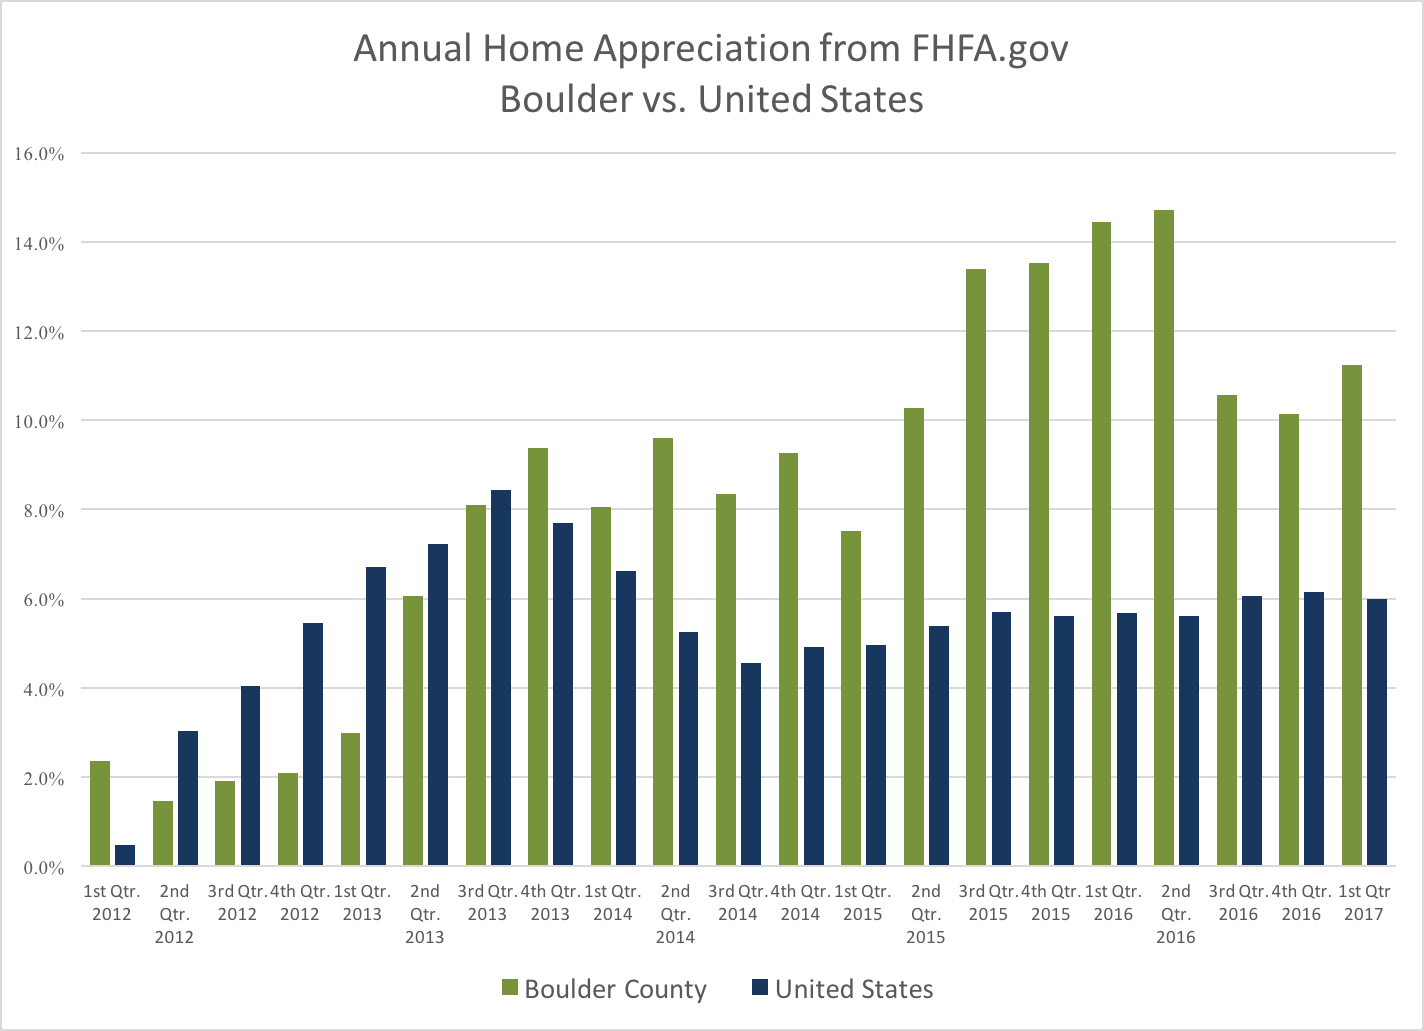
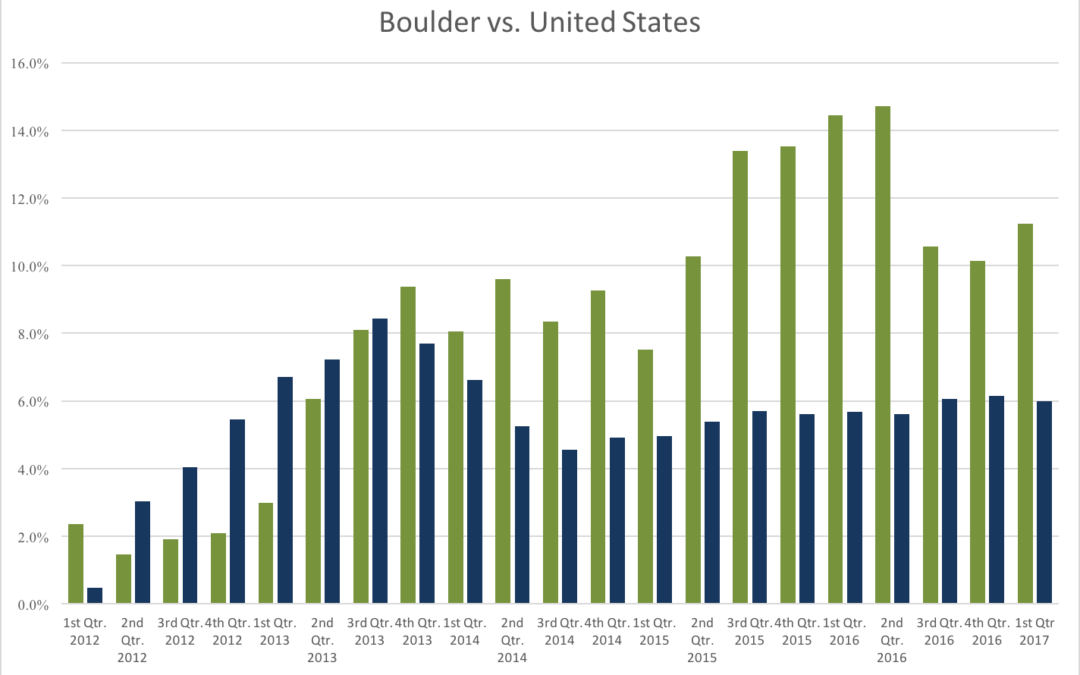
According to the most recent FHFA.gov Home Price Index quarterly report the one year appreciation in Boulder County for the period ending March 31, 2017 was 11.23%. This ranks us 12th highest in the nation out of the 257 largest Metropolitan Statistical Districts that were studied. Our area has been ranked in the top 15 for eight straight quarters including a #1 ranking for the period ending June 30th 2016. The first chart below shows the annual appreciation reported on a quarterly basis for both Boulder County (green) and the United States average (blue). The last five years have been one of our strongest “bull runs” in our history. Over the past five years, the average home has appreciated 55%.

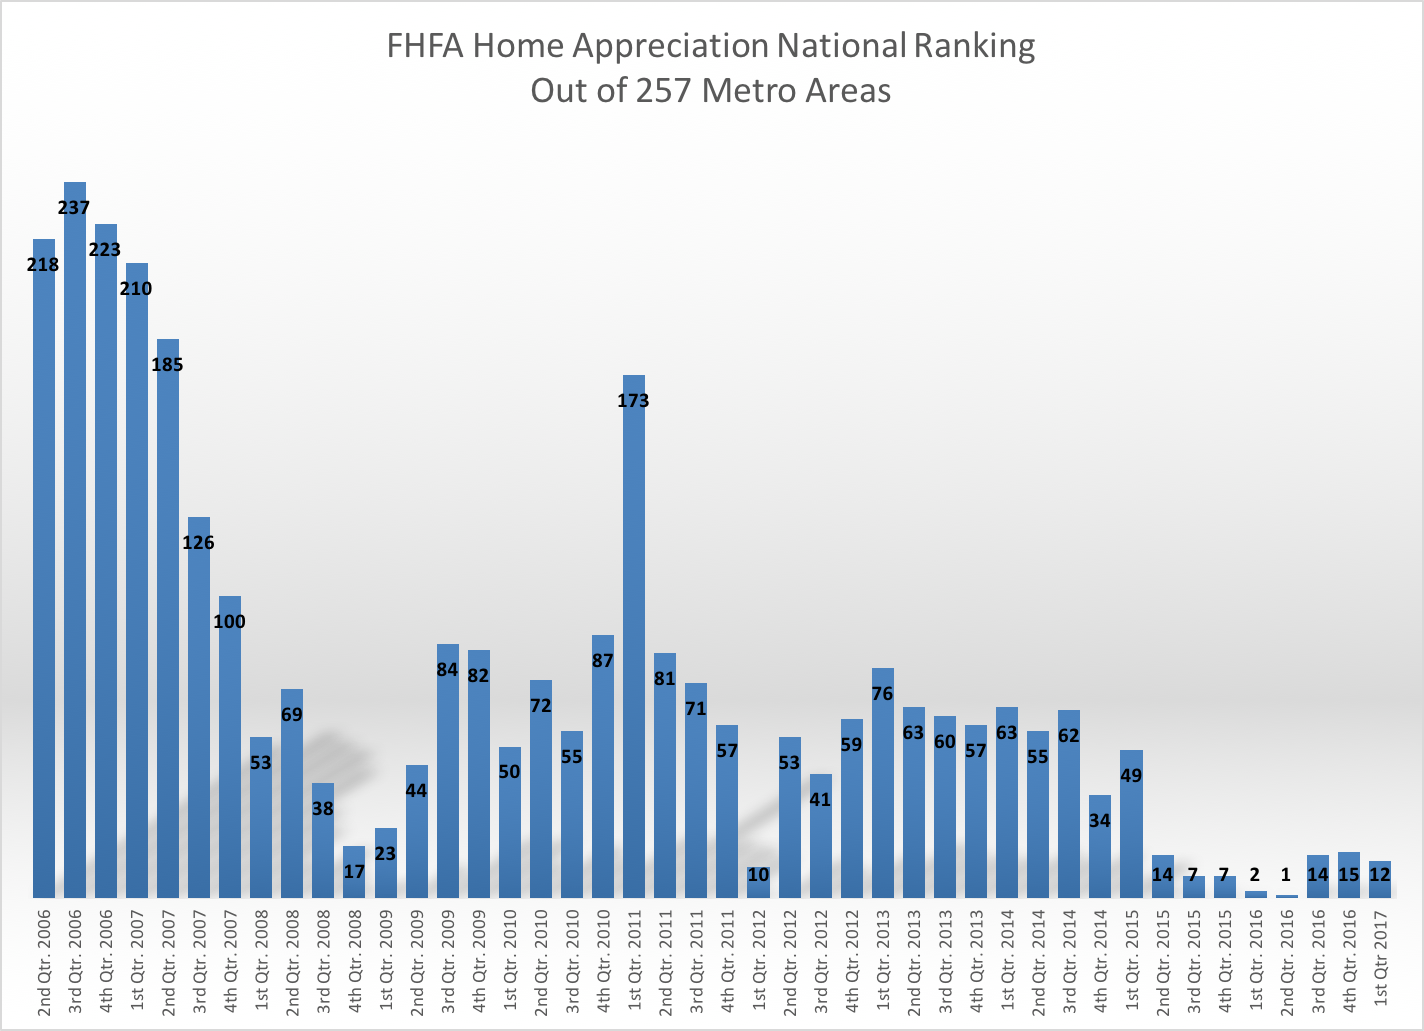
The chart below shows our national ranking compared to the 257 other markets in the FHFA report since 2nd quarter of 2006. This is an interesting graph because it shows that just before the economic downturn in 2008 our market was actually in the last quartile. Our annualized returns at that time were in the 1 to 3% range. As the downturn started and the real estate market came to a grinding halt our ranking improved compared to the rest of the country. During 2008 our appreciation remained above +2%. From 2009 – 2011 our average annual appreciation ranged from +2% to -2.8%. It turns out that we were one of the most stable markets in the country.

This got me to thinking about how we compare to other currently “hot” markets over the last 5 and 10 year time frames. First I identified the areas that currently are ahead of Boulder County in appreciation over the past five years. With 55% appreciation we are ranked 28th in the nation. Reno, NV is ranked #1 with 86% appreciation over the past five years. Here is the list showing the ranking over the past five years. The table is sorted by the highest to lowest in the bolded column.
| City |
2007-2012 Appreciation |
20012-2017 Appreciation |
10 Year Appreciation |
|
| Reno, NV |
-51% |
86% |
35% |
1 |
| Modesto, CA |
-58% |
84% |
26% |
2 |
| Stockton, CA |
-57% |
82% |
25% |
3 |
| Bend, OR |
-43% |
79% |
36% |
4 |
| Las Vegas, NV |
-60% |
78% |
18% |
5 |
| Merced, CA |
-61% |
75% |
14% |
6 |
| San Francisco, CA |
-21% |
73% |
52% |
7 |
| Oakland, CA |
-35% |
73% |
38% |
8 |
| Santa Rosa, CA |
-37% |
69% |
32% |
9 |
| West Palm Beach, FL |
-46% |
69% |
23% |
10 |
| Napa, CA |
-40% |
69% |
29% |
11 |
| Port Lucie, FL |
-52% |
68% |
16% |
12 |
| Yuba City, CA |
-49% |
67% |
18% |
13 |
| Sarasota, FL |
-47% |
67% |
20% |
14 |
| Cape Coral, FL |
-50% |
67% |
16% |
15 |
| Phoenix, AZ |
-48% |
67% |
19% |
16 |
| San Jose, CA |
-23% |
66% |
43% |
17 |
| Salinas, CA |
-51% |
66% |
14% |
18 |
| Sacramento, CA |
-43% |
64% |
21% |
19 |
| Miami, FL |
-46% |
64% |
18% |
20 |
| Denver, CO |
-5% |
62% |
57% |
21 |
| Riverside, CA |
-49% |
62% |
14% |
22 |
| Palm Bay, FL |
-47% |
62% |
15% |
23 |
| Portland, OR |
-22% |
59% |
36% |
24 |
| Boise, ID |
-36% |
58% |
22% |
25 |
| Daytona Beach, FL |
-49% |
57% |
8% |
26 |
| Greeley, CO |
-13% |
57% |
44% |
27 |
| Boulder, CO |
2% |
55% |
56% |
28 |
Now here is the list sorted for the previous five year time period 2007 – 2012. This represents the end of a bull market in many areas and then through the heart of the housing recession. During this time period Boulder is ranked #1 with 2% appreciation, Denver is ranked #2 with -5%.
| City |
2007-2012 Appreciation |
20012-2017 Appreciation |
10 Year Appreciation |
| Boulder, CO |
2% |
55% |
56% |
| Denver, CO |
-5% |
62% |
57% |
| Greeley, CO |
-13% |
57% |
44% |
| San Francisco, CA |
-21% |
73% |
52% |
| Portland, OR |
-22% |
59% |
36% |
| San Jose, CA |
-23% |
66% |
43% |
| Oakland, CA |
-35% |
73% |
38% |
| Boise, ID |
-36% |
58% |
22% |
| Santa Rosa, CA |
-37% |
69% |
32% |
| Napa, CA |
-40% |
69% |
29% |
| Sacramento, CA |
-43% |
64% |
21% |
| Bend, OR |
-43% |
79% |
36% |
| Miami, FL |
-46% |
64% |
18% |
| West Palm Beach, FL |
-46% |
69% |
23% |
| Palm Bay, FL |
-47% |
62% |
15% |
| Sarasota, FL |
-47% |
67% |
20% |
| Phoenix, AZ |
-48% |
67% |
19% |
| Riverside, CA |
-49% |
62% |
14% |
| Daytona Beach, FL |
-49% |
57% |
8% |
| Yuba City, CA |
-49% |
67% |
18% |
| Cape Coral, FL |
-50% |
67% |
16% |
| Reno, NV |
-51% |
86% |
35% |
| Salinas, CA |
-51% |
66% |
14% |
| Port Lucie, FL |
-52% |
68% |
16% |
| Stockton, CA |
-57% |
82% |
25% |
| Modesto, CA |
-58% |
84% |
26% |
| Las Vegas, NV |
-60% |
78% |
18% |
| Merced, CA |
-61% |
75% |
14% |
When you sort for total appreciation over the past 10 years (right column) you see that Denver and Boulder are neck and neck with 57% and 56% respectively. San Francisco is ranked in 3rd place with 52%.
| City |
2007-2012 |
20012-2017 |
10 Year Appreciation |
| Denver, CO |
-5% |
62% |
57% |
| Boulder, CO |
2% |
55% |
56% |
| San Francisco, CA |
-21% |
73% |
52% |
| Greeley, CO |
-13% |
57% |
44% |
| San Jose, CA |
-23% |
66% |
43% |
| Oakland, CA |
-35% |
73% |
38% |
| Portland, OR |
-22% |
59% |
36% |
| Bend, OR |
-43% |
79% |
36% |
| Reno, NV |
-51% |
86% |
35% |
| Santa Rosa, CA |
-37% |
69% |
32% |
| Napa, CA |
-40% |
69% |
29% |
| Modesto, CA |
-58% |
84% |
26% |
| Stockton, CA |
-57% |
82% |
25% |
| West Palm Beach, FL |
-46% |
69% |
23% |
| Boise, ID |
-36% |
58% |
22% |
| Sacramento, CA |
-43% |
64% |
21% |
| Sarasota, FL |
-47% |
67% |
20% |
| Phoenix, AZ |
-48% |
67% |
19% |
| Miami, FL |
-46% |
64% |
18% |
| Las Vegas, NV |
-60% |
78% |
18% |
| Yuba City, CA |
-49% |
67% |
18% |
| Cape Coral, FL |
-50% |
67% |
16% |
| Port Lucie, FL |
-52% |
68% |
16% |
| Palm Bay, FL |
-47% |
62% |
15% |
| Salinas, CA |
-51% |
66% |
14% |
| Merced, CA |
-61% |
75% |
14% |
| Riverside, CA |
-49% |
62% |
14% |
| Daytona Beach, FL |
-49% |
57% |
8% |
Over time, our consistently good market has been fueled by limited building, a growing population, a strong and diverse economy and a location with a lifestyle where people want to live. Although I don’t expect that our market will continue to appreciate at it current pace, alas it is all a cycle, I do think that these factors will continue to make our market one of the most consistent in the nation. A great place to invest.

by Neil Kearney | May 24, 2017 | Boulder County Housing Trends, Statistics
 I have just published The Kearney Report for the 1st Quarter of 2017. The entire report can be viewed below on this page or you can download the PDF link here The Kearney Report 1st Quarter 2017
Real Estate Market Update
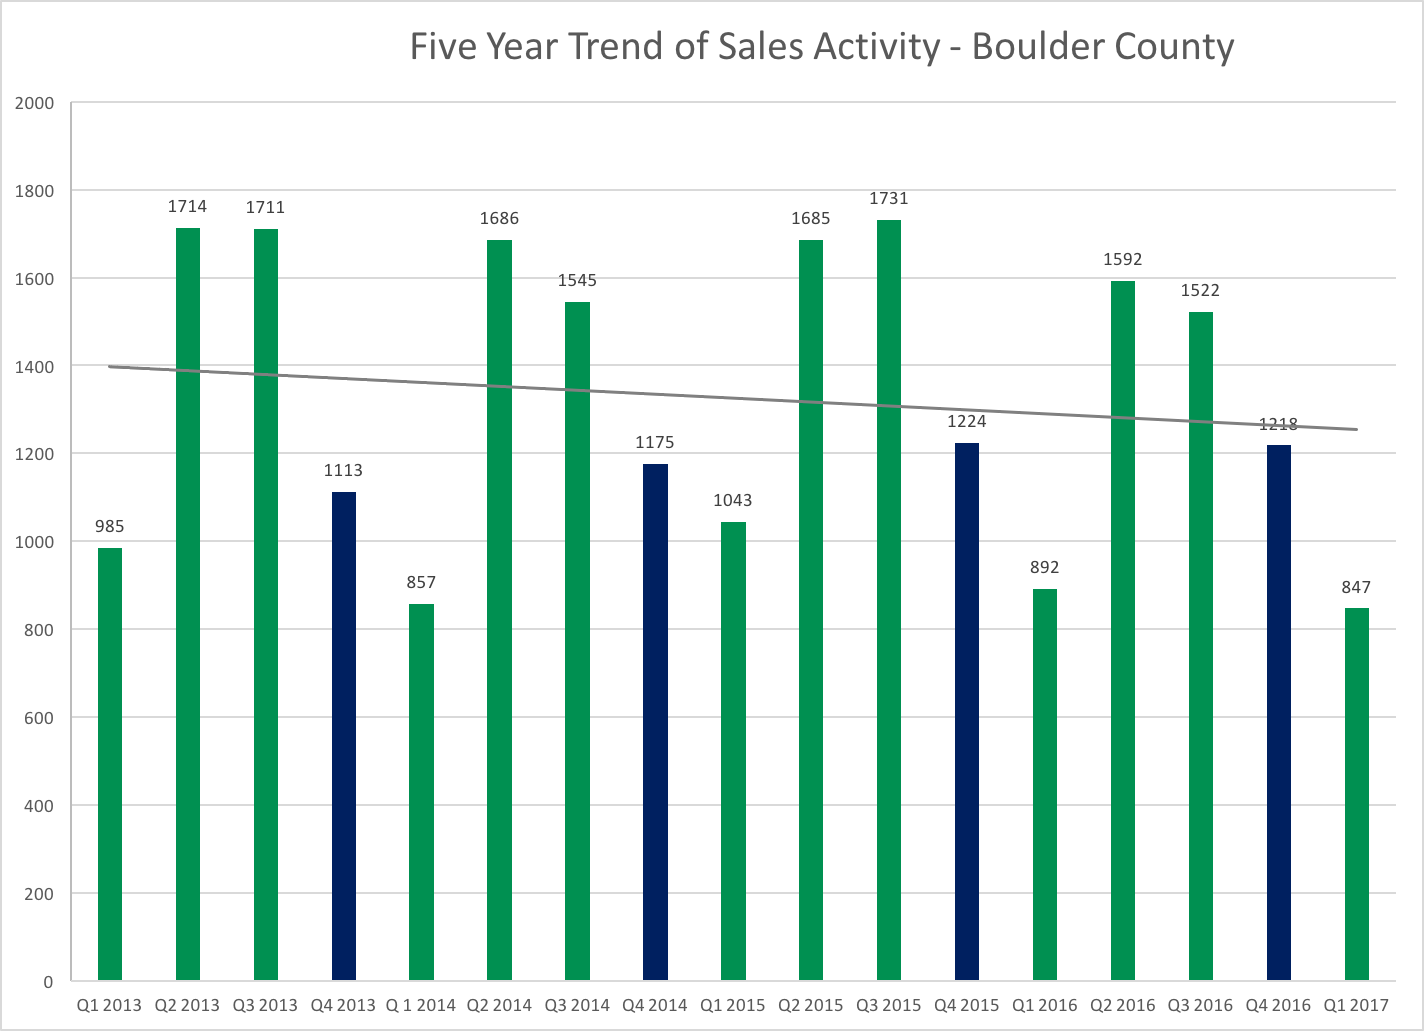
The Boulder area real estate market has been one of the most robust markets in the nation over the past few years. The market has been characterized by steady sales, low inventory and rapidly rising prices. This trend continued through the first quarter of 2017.
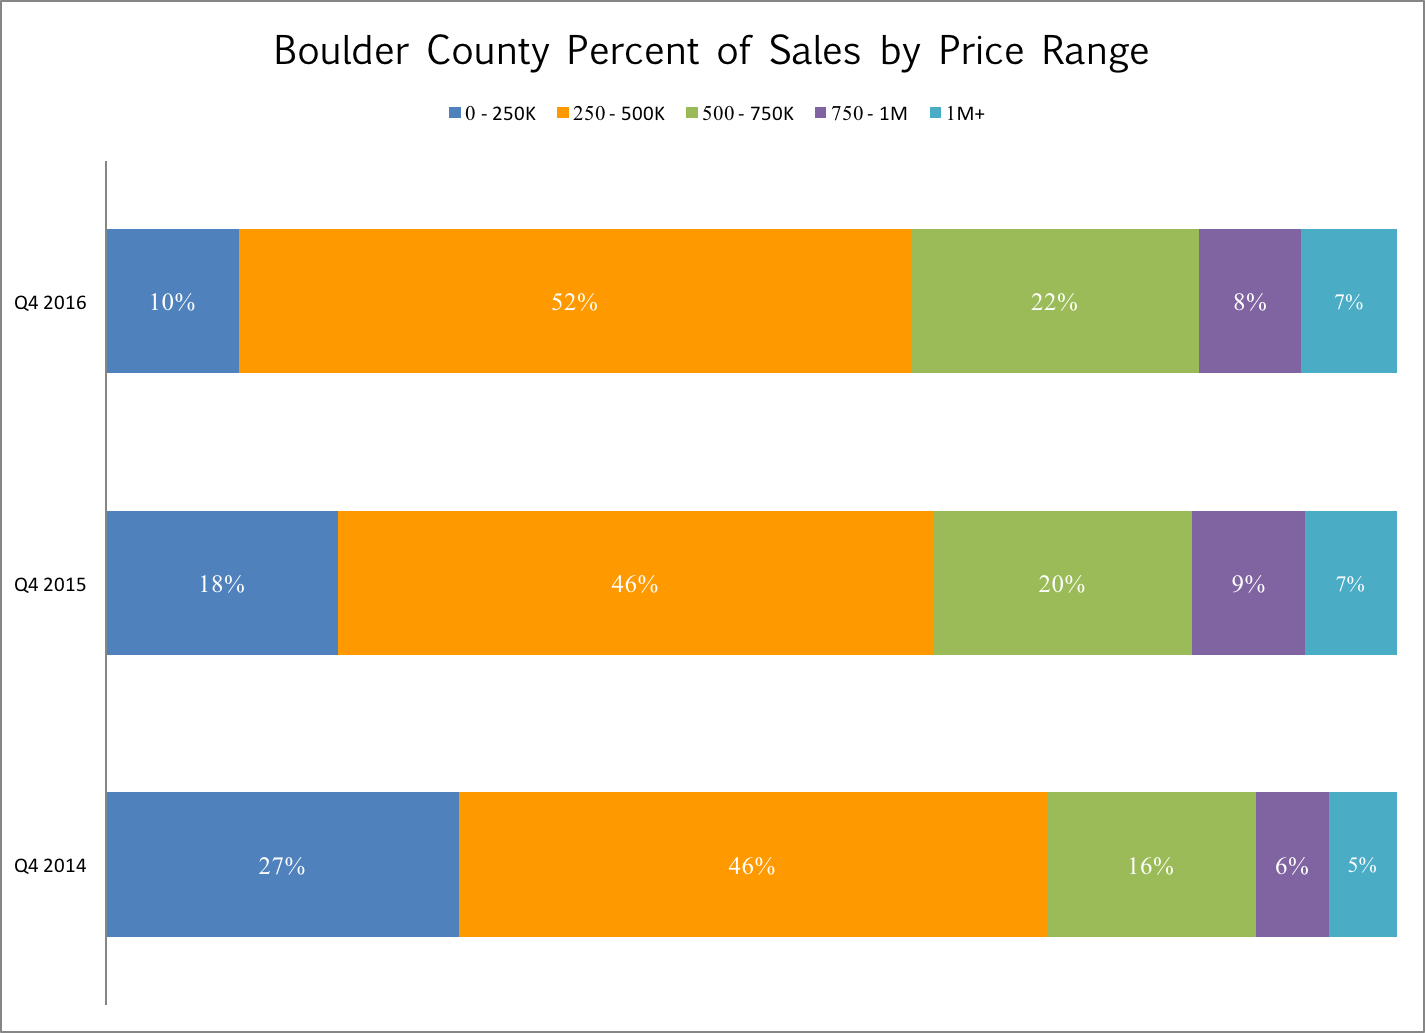
During the first quarter of 2017 there were 847 sales in Boulder County which reflects a 5% drop from the previous year. The median sales price during the quarter was $465,000 which is 9% higher than it was a year ago. Inventory, especially towards the end of the quarter and then extending into April and May has increased giving buyers more breathing room to shop for homes. During the first quarter, 35% of the sales had a price above the list price, 20% were at the asking price and 45% were below. Of those that did sell above list price the average premium paid was 4.4%. During the first quarter of 2016, 42% sold above list price and the average premium paid was 5.5%. It seems that calling this a slow down is splitting hairs but during that same period it was my experience that showings were down and the number of offers received on any one property was down as well.
Through the end of April the total number of residential sales in Boulder County is up roughly 1% with January and March exceeding last year and February and April lagging last years totals. We still do have a great influx of new residents which has been fueling the unusually strong market but whether it be higher interest rates or higher prices, or both, the activity has lessened.
You may have noticed that there are not many for sale signs out there. The inventory of “for sale” homes in Boulder County at the end of the 1st quarter is up 12% from a year ago. There are definitely more choices out there. I have seen many listings that have fit into this predictable pattern: the house gets listed for a high price compared to recent sales in the neighborhood (the hope), after 10 days or so of moderate showings and no offers (the reality) the sellers reduce the price (the chase) hoping to rekindle interest in their home. In my experience it’s more difficult to make an adjustment after 10 days and get interest than it is to price it right in the first place.
As you browse through the rest of the report you will find, for comparison purposes, a number of market measures displayed for each of the submarkets in our area. Enjoy the report.
Here is our advice for buyers and sellers in the current market.
Buyers – Interest rates are increasing slowly and with increased inventory you may be able to avoid competing for a home with other buyers. On average, homes are still selling for just below asking price. If you are patient you may reap the rewards of waiting for a seller to become motivated and find that the price that you pay is reasonable compared to the neighborhood.
Sellers – Properties are still selling however the exuberance of past years isn’t there. This may be a good time to lock in the gains we have seen in the market over the past three years. When pricing your property lean towards reality and away from greedy and you will most likely find a buyer who is on the same page. “Testing” the market can have poor results if you find your house still on the market two weeks later. Price reductions don’t have the same impact of a well priced new listing.


by Neil Kearney | May 23, 2017 | Boulder County Housing Trends, Statistics
Each spring since 2013 the real estate market in Boulder County could be characterized as frenetic. This year the market is a bit more tempered. If you just look at April’s numbers the market seems similar to a year ago. Sales are similar, inventory is up, prices are up… However, despite strong forward looking sales it seems that the market has lost some of the strength we have seen over the past three springs. Houses are staying on the market longer and there are fewer showings on new listings. It will be interesting to see how it plays out but we don’t usually see the market slow down until late June and we are seeing it earlier this year in some segments.
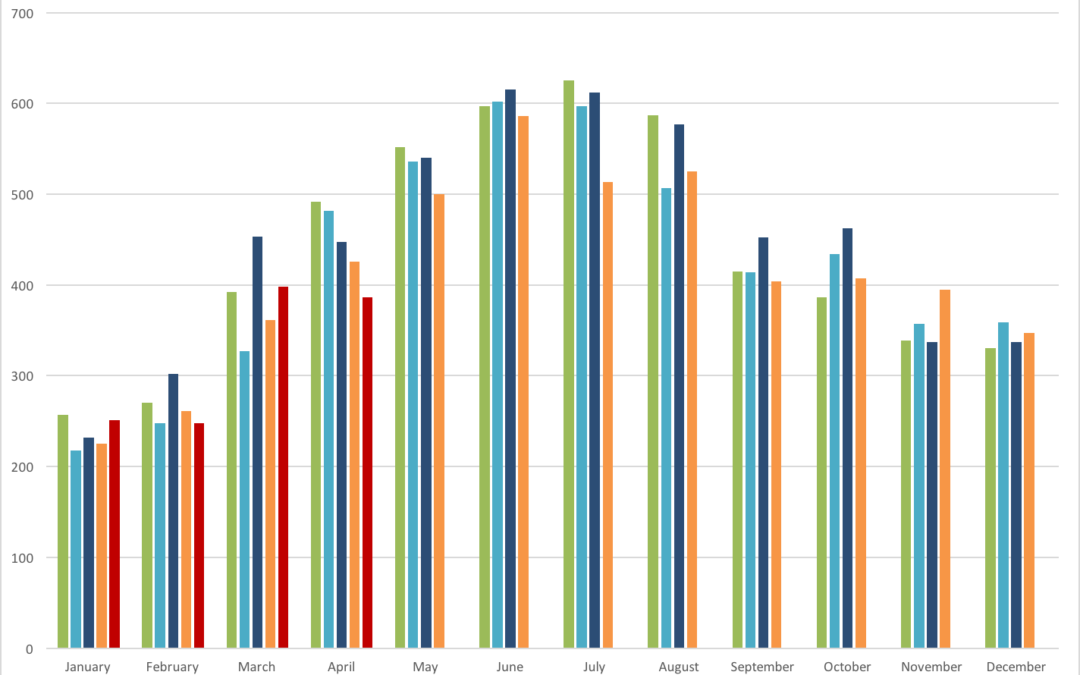
Sales in April were down 9.4% when compared to last April. Year-to-date sales are still up 1% but it seems that this year is losing a bit of steam. Anecdotally, there have been fewer than expected showings on listings and even on popular properties when multiple offers have been received, the numbers of showings and offers is down. The slideshow below illustrates graphically different segments of the local real estate market including; number of sales, inventory (which is rising), under contract percentage etc.

 With property values increasing as steadily and as rapidly as they are in Boulder County, it should come at no surprise that property taxes are following suit. This became very clear this past May when assessment notices made their way around town informing Boulder County residents that the assessed value of their property had significantly increased by on average 26%. Although it is exciting to watch the value of your assets increase it does mean that property taxes will most likely increase for you as well.
 As taxes rise, one tax exemption that may be important for you or your family members to know of is the Senior Property Tax Exemption. With the deadline of July 15th rapidly approaching it can be helpful to understand what this exemption is, how much it could save you, and of course if you are eligible. Those that are eligible for the Senior Property Tax Exemption will receive a 50% property tax deduction on the first $200,000 of the properties value equating to between $550 and $760 of property tax savings per year.