by Neil Kearney | Jun 4, 2020 | Boulder County Housing Trends, Statistics
This past week really felt like we were back up to speed. Showings stayed strong and the number of properties going under contract this past week surged to a level higher than any of the last four years during the same week. The higher price ranges are still lagging, but we are seeing an increase in showings. Closings are still down, but there was an increase for the week due to the end of the week.

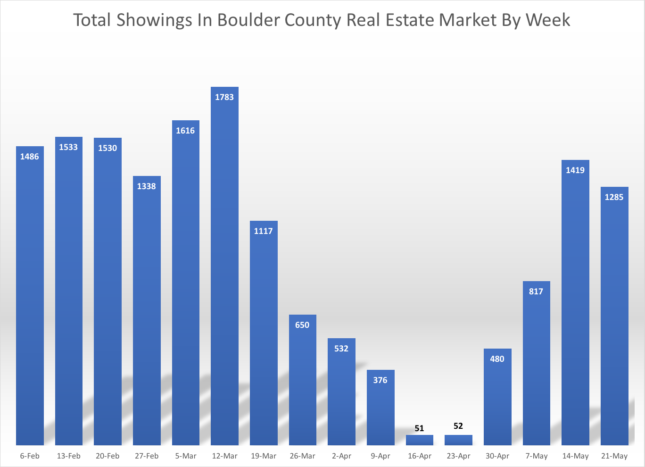
This graph shows the total showings for the week in all price ranges. Showings seem to be at a near normal level.

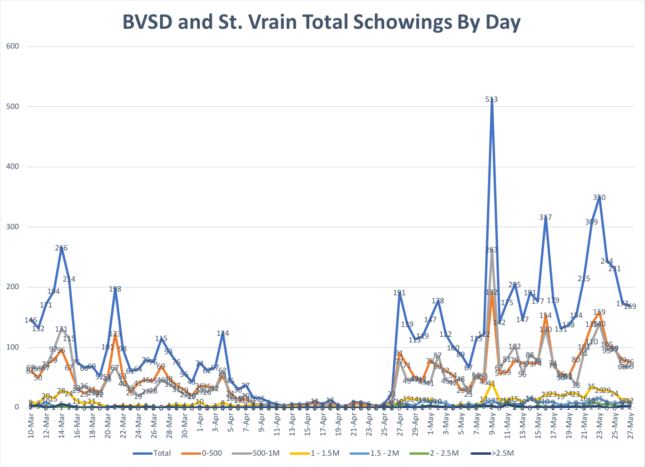
This graph shows the number of showings in the Boulder/Longmont area by day since March 10th. We are seeing a surge of activity on Saturdays.
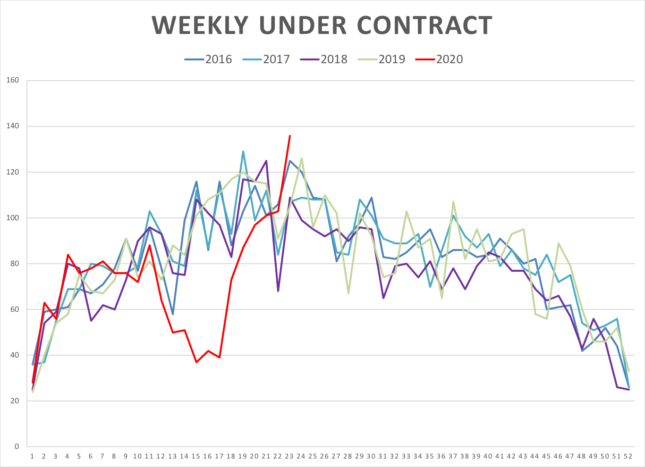
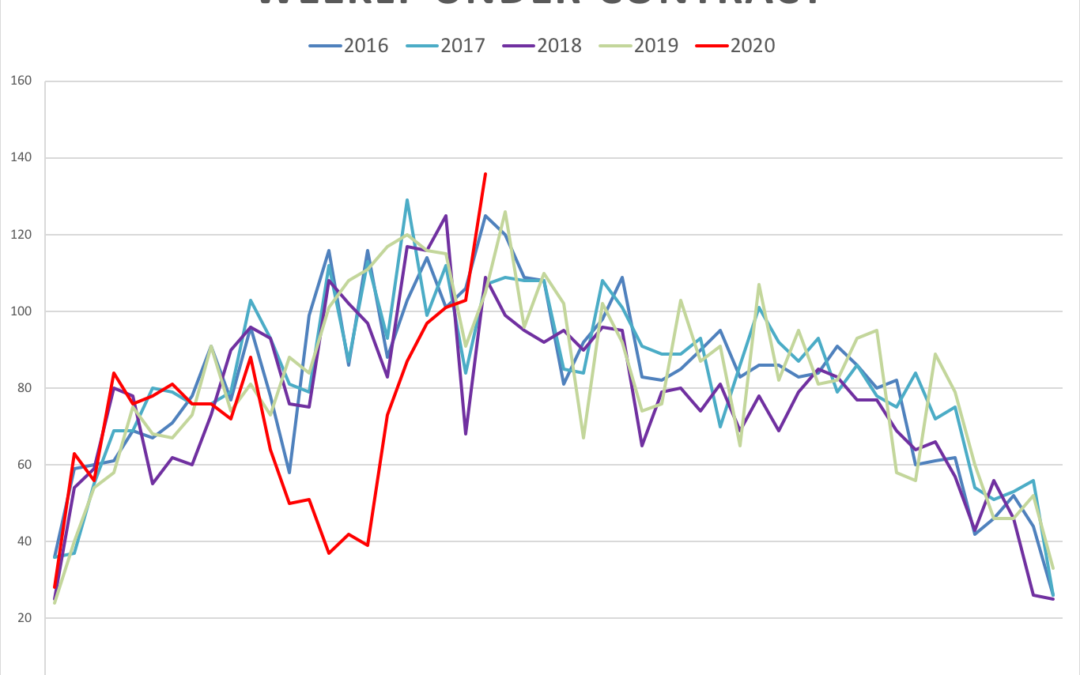
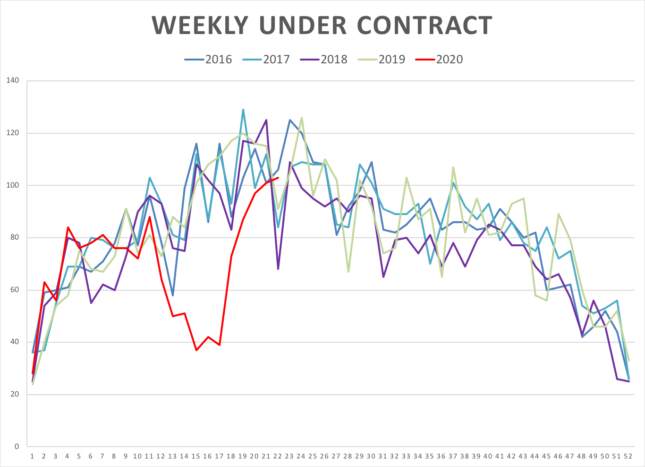
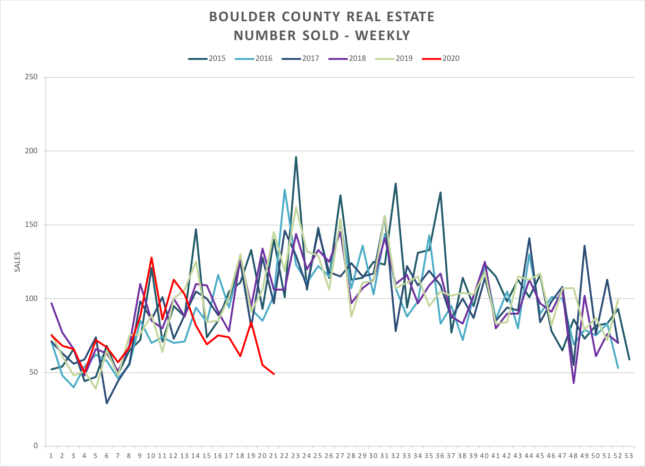
There was a big surge in accepted contracts this week. Surprisingly the number of contracts accepted this past week exceeded any other single week over the past four years.

Since there is typically a 30-45 day lag between contract acceptance and the closing, the number of closings is still is lower than normal. Given the number of accepted contracts recently, it appears that we may be back up to normal numbers by the end of June.
by Neil Kearney | May 28, 2020 | Listings
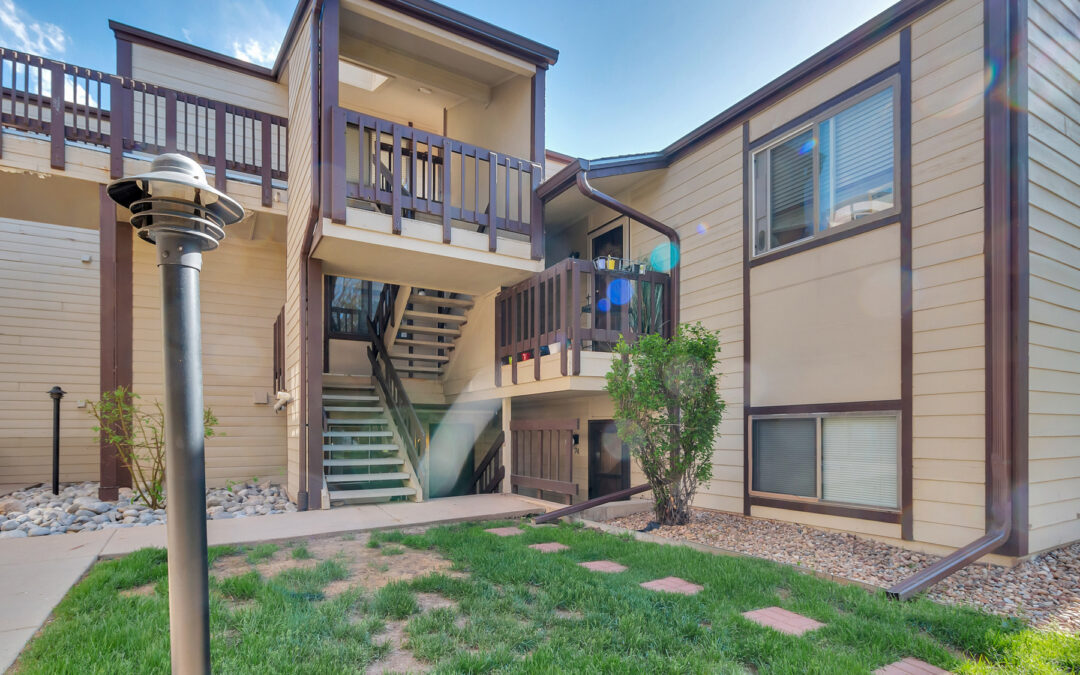
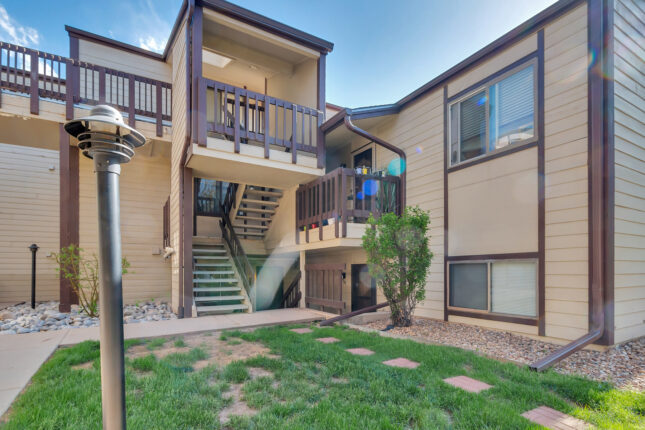
Well located and upgraded 2 bedroom, 1 3/4 bath Boulder condo. The home features a living room fireplace and private south facing patio. It comes with a one car detached garage and is a short walk to Howard Heuston Park. Upgrades in the kitchen, tile floors and newer carpet. The property is nestled in a prime north Boulder location close to transportation routes (RTD and bike paths) and shopping centers.


by Neil Kearney | May 28, 2020 | Boulder County Housing Trends, Statistics
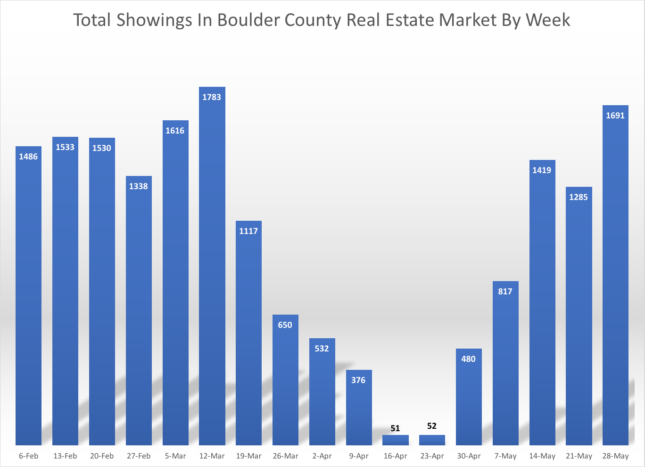
Our communities are taking steps to open up the economy. I’ve definitely noticed more traffic, filled parking spaces downtown and a few businesses using their space again in my office building. Some restaurants began to seat customers yesterday and more and more buyers and sellers are slowly coming back into the local real estate market. On an aggregate basis showings were up 31% this past week. Up to 1,691 showings (data from ShowingTime). We were last at this level in early March. Progress.
Usually Memorial Day week is fairly slow. But we saw a nice surge of new listings and the number of new accepted contracts stayed strong. Much of this activity is in the lower price ranges, but not exclusively.
Here is a breakdown of inventory and the percentage of those listings which are under contract by price. Residential listings in Boulder County.
$0 - $500k
Total Listings = 448
57% are under contract
$500k - $1 Million
Total Listings = 651
45% are under contract
$1 - $1.5 million
Total Listings = 162
23% are under contract
$1.5 - $2 million
Total Listings = 79
18% are under contract
$2 - $2.5 million
Total Listings = 41
19% are under contract
More Than $2.5 million
Total Listings = 76
9% are under contract
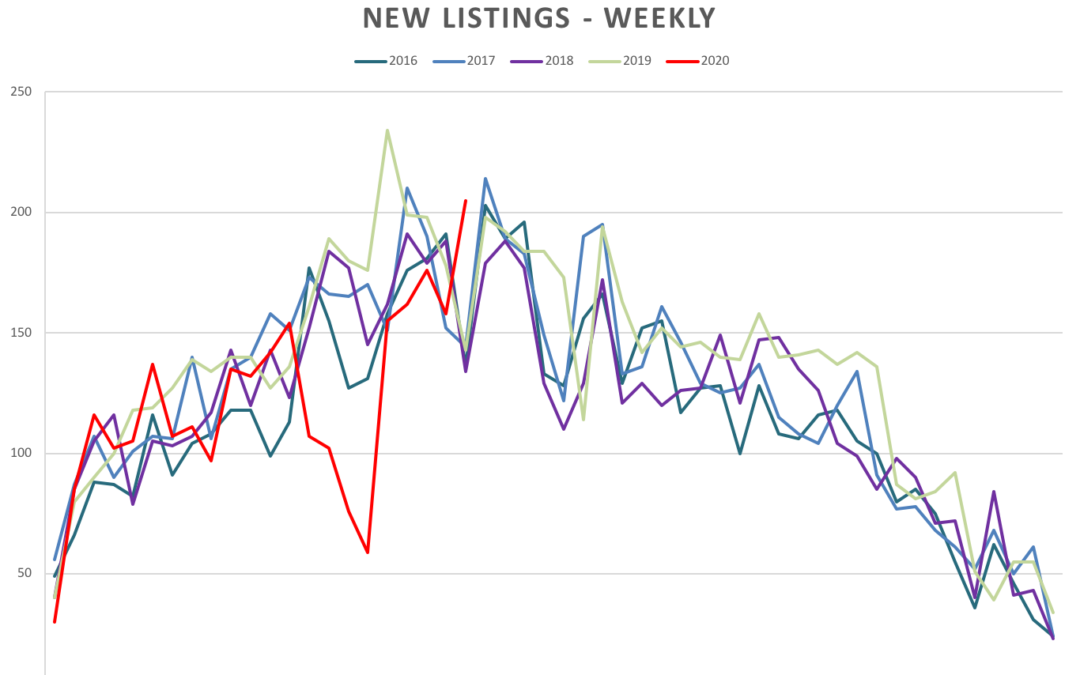
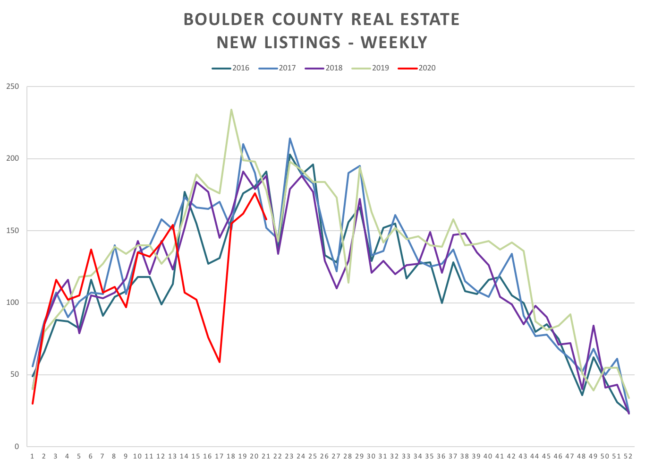
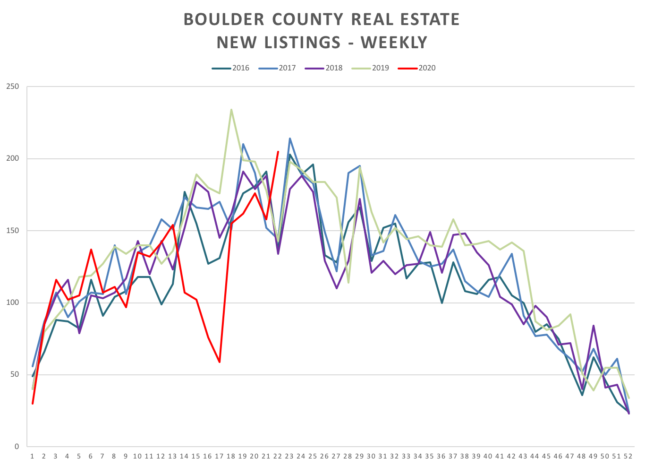 The graph above shows the new listings which have come on the market on a weekly basis over the past five years. The red line shows the activity this year. We have seen many new listings hit the market in May.
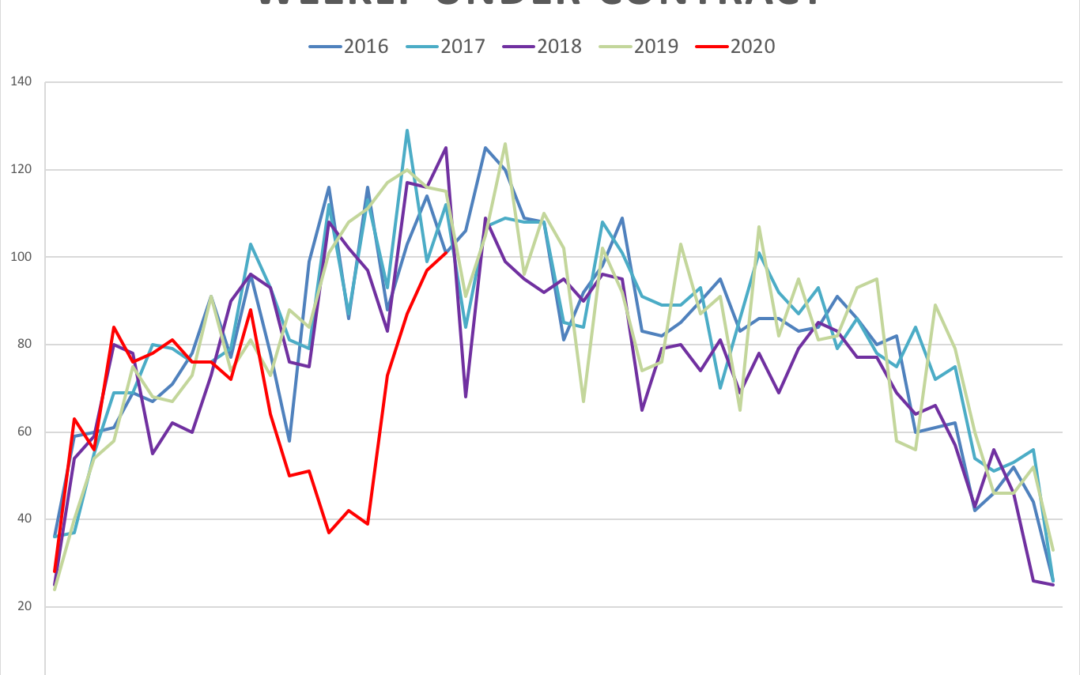
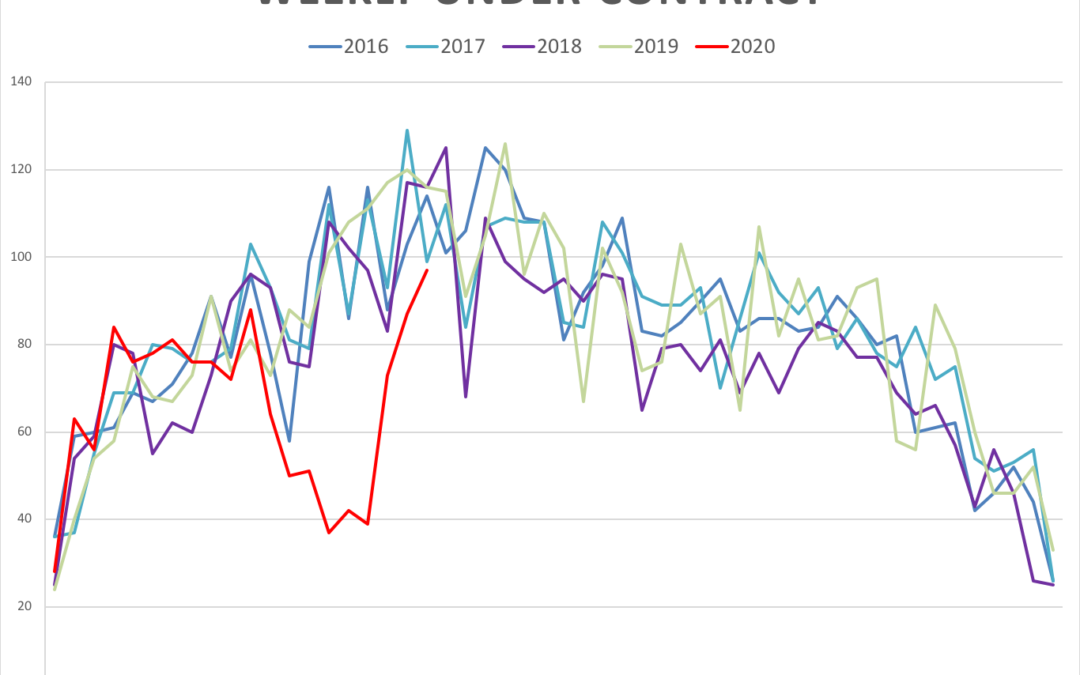
The graph directly above shows the number of listings that have gone under contract on a weekly basis. Since showings were again approved we have seen good contract activity. From the information above (orange toggles) you can see the strongest market is below $1,000,000.
As the weeks progress and as people get back to work it will be interesting to see if there is a surge in buyer activity. If not, we may see an increase in inventory. This isn’t a bad scenario since we have been low on listings for a number of years. But the risk of an imbalance (more supply than demand) is that it will take longer for homes to sell and there will be overall negative price pressure. As long as interest rates remain low and buyers can obtain mortgages, this is a good thing for buyers.
by Neil Kearney | May 21, 2020 | Boulder County Housing Trends, Statistics
Showings on occupied listings have been up and running (with safety restrictions) for almost two weeks. It was a strong week of activity. 101 properties went under contract. This is down just 14 properties from the same week last year. There were 158 new listings during the week which is comparable to a normal year. Price reductions have been increasing as sellers get serious about selling, now that showings have resumed. Predictably the number of closings continues to slow. This is the result of the complete shut down in late March and April. For more information see the captions of the graphs below.

101 properties went under contract during the week in Boulder County.
New listings have climbed steadily over the past few weeks. Many sellers who had planned to list in March or April are now testing the market.
Showings for the week were active, but showed a decrease from the week before.
Showings are still much more active in the lower price ranges.
Showings happening now are the result of contracts written in March and April. We should see a decline for a few more weeks before it starts to recover.
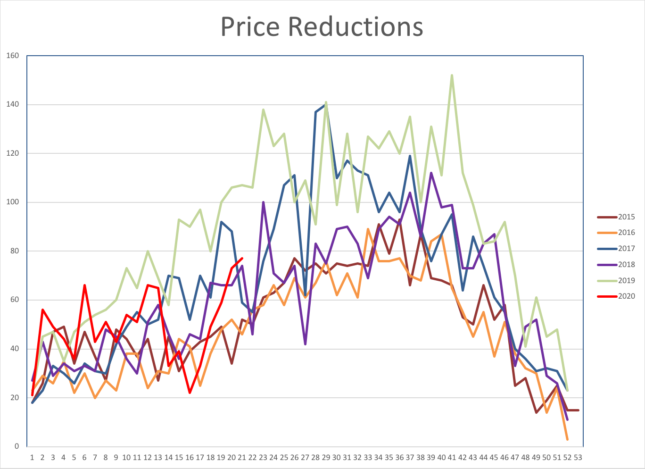
Price reductions are a measure of the overall strength of the market. As houses stay on the market longer sellers decrease the price, trying to attract buyers.
by Neil Kearney | May 14, 2020 | Boulder County Housing Trends, Statistics
On Saturday May 9th Colorado transitioned into “Safer at Home” regulations. Certain stores and services were able to reopen and Realtors were given the ability to resume showings on occupied properties. This came with added safety measures such as cleaning surfaces before and after showings, social distancing during showings, wearing masks and gloves. The good news was that many buyers (and agents) were ready to go out into the world and view those properties they had been eyeing online. On Saturday we had a big spike. The spike was followed by a general improvement in showings and general activity. The graphs below tell the showing story.
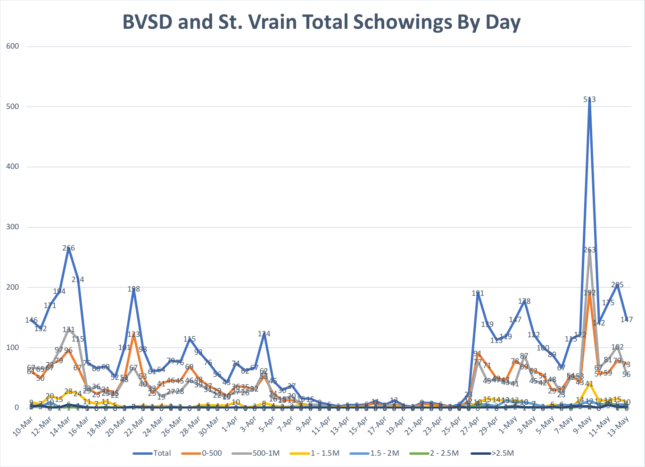
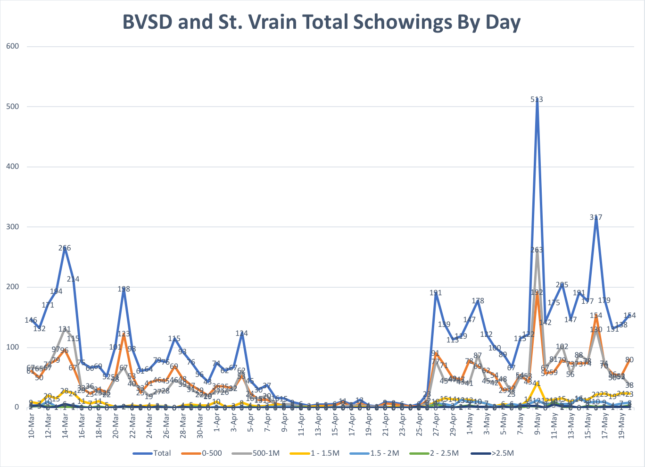
Showings in the broad Boulder area market (Boulder Valley and St. Vrain School Districts) recorded by day. Note the big spike on may 9th.
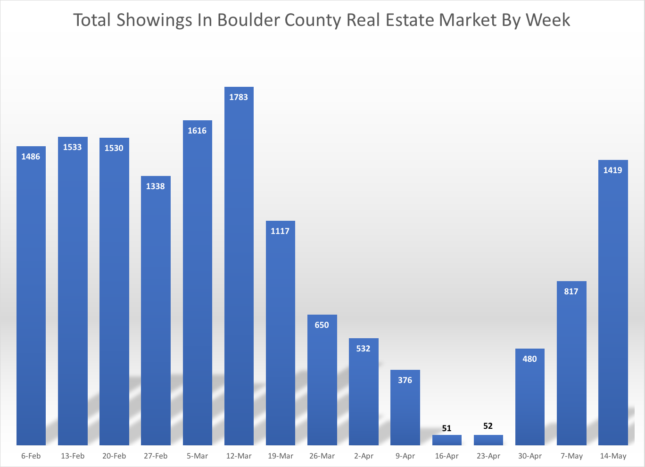
Total showings for the week in the overall Boulder Area Market set through ShowingTime.
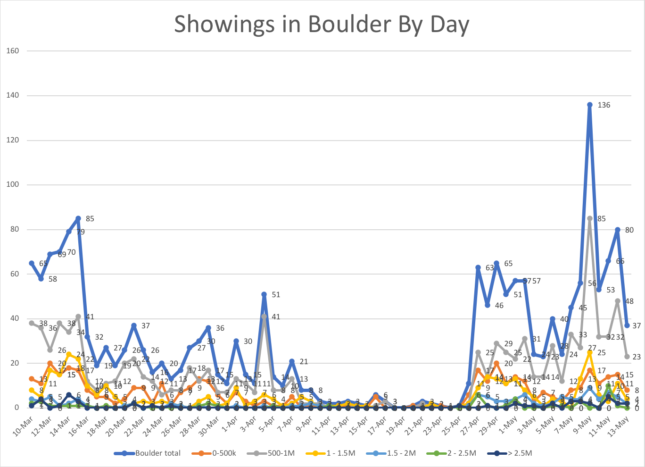
Showings in the City of Boulder by day since March 10, 2020 set by ShowingTime showing service.
Number of Accepted Contracts Continued to Climb
The increased showings resulted in an increase in accepted contracts for the week. Last week there were 87 properties that went under contract and this week that number grew to 97. One year ago this week 116 properties went under contract. In my opinion this is really good activity!
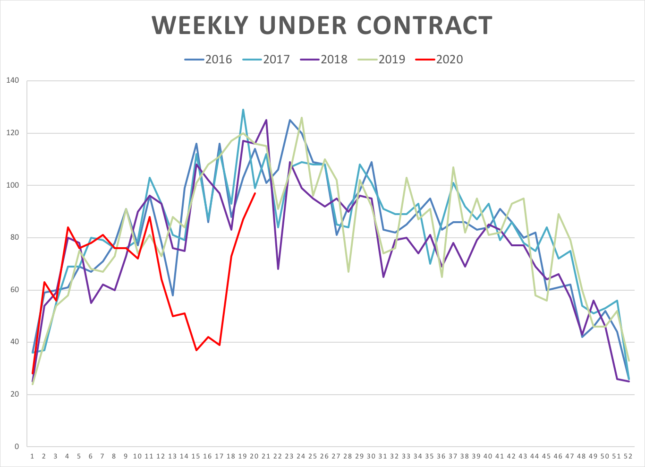
The chart above shows the number of properties that went under contract on a weekly basis. The red line is 2020.

New listings increased significantly as Sellers who have been delaying got back in the market.

Sales are a lagging statistic. Since it typically takes 30-60 days to move from contract to closing, we are now starting to see the results of the activity in March and April. I expect the red line will be moving downward for a number of weeks.
Overall, I’m pleased with the activity in the market. It feels like we are moving forward. I’m starting to get more calls and am having planning meetings with sellers who will shortly be listing their properties. Stay safe out there and have a good weekend! Next week I may show you my haircut.

