
This past week really felt like we were back up to speed. Showings stayed strong and the number of properties going under contract this past week surged to a level higher than any of the last four years during the same week. The higher price ranges are still lagging, but we are seeing an increase in showings. Closings are still down, but there was an increase for the week due to the end of the week.

This graph shows the total showings for the week in all price ranges. Showings seem to be at a near normal level.

This graph shows the number of showings in the Boulder/Longmont area by day since March 10th. We are seeing a surge of activity on Saturdays.
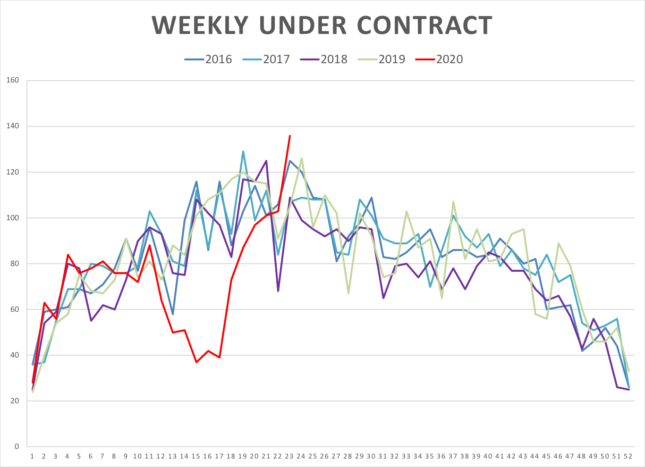
There was a big surge in accepted contracts this week. Surprisingly the number of contracts accepted this past week exceeded any other single week over the past four years.

Since there is typically a 30-45 day lag between contract acceptance and the closing, the number of closings is still is lower than normal. Given the number of accepted contracts recently, it appears that we may be back up to normal numbers by the end of June.

