by Neil Kearney | Feb 14, 2014 | Boulder County Housing Trends, Statistics
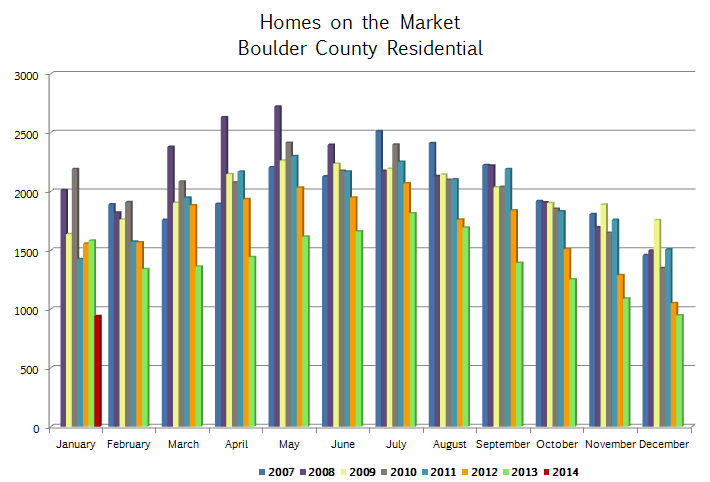
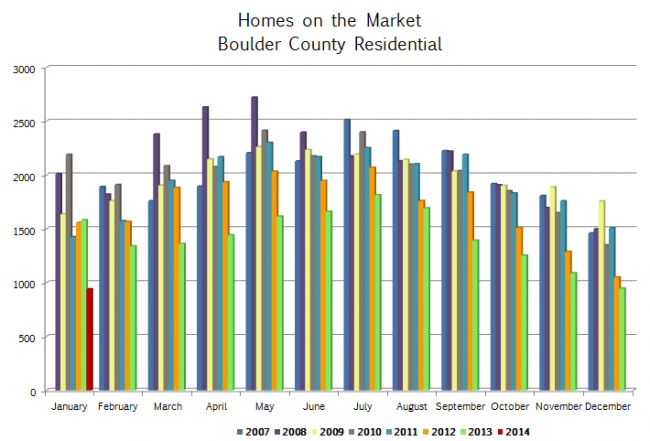
This year, the real estate market in Boulder County is getting off to a measured start. Sales were down 15% compared to last year during the month. Given that last year we were off to such a quick start, this is not too surprising. But what is concerning is the continuing trend of low inventory. The graph below shows the current (as of January 31st) inventory of available listings in Boulder County over the past six years. The current month is represented by the short red stick on the left hand side. If you are a buyer the pickin’s are pretty slim.
To see more market statistics in detail please browse through the slideshow below.

by Neil Kearney | Feb 6, 2014 | Boulder County Housing Trends, Statistics |
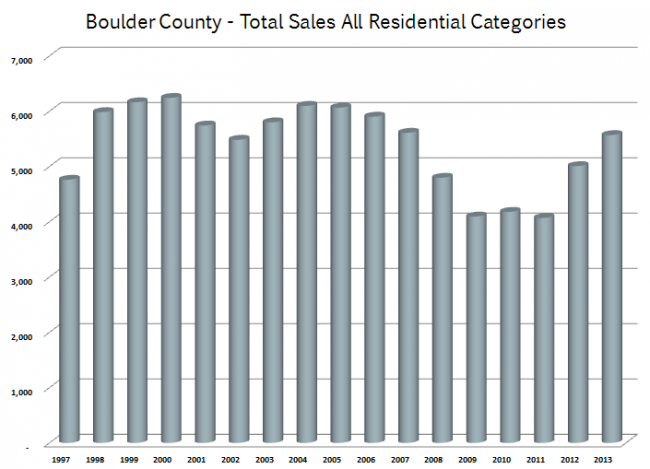 Sales of residential real estate in Boulder County increased by 9.7% during 2013. The graph above shows how last year compares to the past 16 years. But the increases were not seen uniformly across all price ranges. The table below shows comparative sales across price ranges and years. A majority of the sales in our area are under $500,000. 32% of all sales are of properties under $250,000 but there was actually a decrease in that price range. In my opinion, the main reason for this is that prices rose about 9% last year and a good percentage of homes jumped into the higher price range. After a quick search I found that in fact 374 properties sold in the $250,000 – $275,000 price range. The combination of the first two lines on the table account for most of the 9.7% increase but the increases in all of the higher price ranges was impressive.
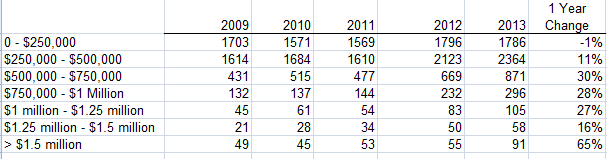
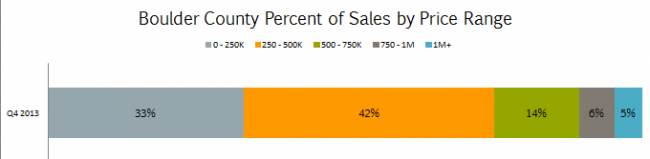
It’s also interesting to see where the greatest increases in sales took place. The largest increase was in the segment of properties above $1.5 million. The 91 sales represented a 65% increase in the number of luxury sales in Boulder County. The chart below is a snapshot of the sales in the 4th quarter of 2013 and shows sales percentages in different price ranges.

by Neil Kearney | Jan 29, 2014 | Boulder County Housing Trends, Statistics
Each quarter I prepare a report on the Boulder area real estate market that puts into context how the market for homes is performing. I’ve just completed the latest iteration of The Kearney Report and the year end provides even more data for explanation and analysis. The Kearney Report is designed to give the reader a broad statistical view of the Boulder County real estate market by giving both the broad view and delving into the details. I will be presenting some of the breakout sections in the coming days but in the spirit of full transparency, today I’m releasing the full report. The text that follows is the summary letter on page two. To view and/or download the entire report in the form of a PDF click here Boulder Market Report Year End 2013.1
 The Economics of Real Estate
Last year in this space I spoke of the recovery of the local real estate market. If the market is likened to a large ship, 2012 was a year where much of the work went into changing directions. By the end of the year the turn was made and it was full speed ahead into 2013. The beginning of 2013 was characterized by a very robust market where buyers were out in force and sellers were reaping the rewards of an improved market and multiple offers. Throughout the spring, sales were strong but new listings were scarce. This brought into play the basic supply/demand curve you may remember from Economics 101. The basic concept of this principle is that if demand exceeds supply then the cost of those goods will naturally increase. We definitely saw this in action. It wasn’t uncommon to have five offers on a home with bidding going well above the asking price. This gave the next seller in the neighborhood to ask even more for their home and many times their “aggressive” price was rewarded with a quick offer. The market frenzy continued until June when buyer demand slowed and more sellers decided to take advantage of the market. Below is a quick summary of the market in 2013. To get a full view of what is happening in the various market segments, I encourage you to study the graphs and explanations included in this report.
The number of residential properties that sold in Boulder County was up 9.7% during the year. Each month sales were higher than the previous four years until fall when the market slowed a bit after the flooding. The number of sales in the price range below $250,000 were down slightly but all other price ranges showed increased sales. The greatest increase was seen in the luxury segment where sales above $1.5 million increased by 65%.
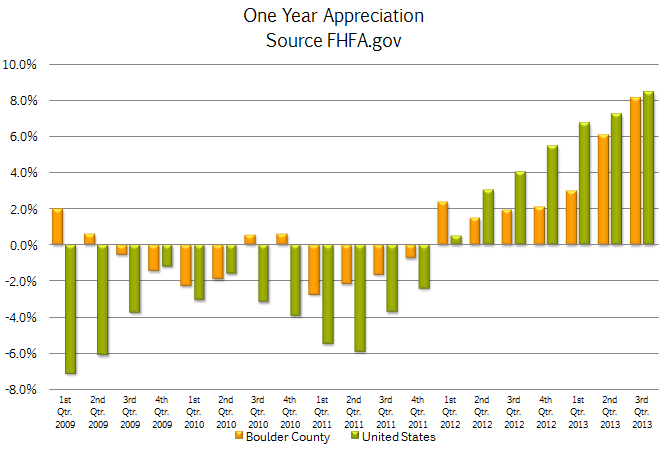
Prices increased throughout our market area. The median price of residential real estate rose by approximately 9% during 2013. This is the largest single year gain we have seen since 2000 when our market was among the best in the nation. Through the third quarter, the national market increased by a similar amount (8.44%). The largest price gains were seen in the markets that were most depressed during the recent downturn. For example, prices in Las Vegas were up by 22.5% last year but they are still down 25% over the past five years. For comparison, Boulder County was up 8.11% (according to FHFA.gov) for the past year and up 7.44% over the past five years. Our one year appreciation ranks our market 60th out of approximately 300 market areas. The tide is rising.
The big story for the year was low inventory. Throughout the year buyers had very little to choose from and by the end of the year the number of active listings was down 37% from just two years ago. To go back to the ship analogy, the waters are clear but we can’t run the engines at full speed because we are low on fuel. In order for the recovery to continue we will need the supply of homes to more closely match the demand. Otherwise, would be buyers will turn into renters in frustration. If you have been thinking about selling but have been putting it off, we would love to explore that possibility with you and let you know if it makes sense for you.
The remainder of this report gives a detailed view on many segments of the local real estate market. If you don’t see your neighborhood represented please give us a call we can run the numbers for your specific area.
by Neil Kearney | Jan 22, 2014 | Boulder County Housing Trends, Statistics
Prices increased throughout our market area during 2013. The median price of residential real estate rose by approximately 9% during the year. This is the largest single year gain we have seen since 2000 when our market was among the best in the nation. Through the third quarter, the national market increased by a similar amount (8.44%). The largest price gains were seen in the markets that were most depressed during the recent downturn. For example, prices in Las Vegas were up by 22.5% last year but they are still down 25% over the past five years. For comparison, Boulder County was up 8.11% (according to FHFA.gov) for the past year and up 7.44% over the past five years. Our one year appreciation ranks our market 60th out of approximately 300 market areas. The tide is rising.
The following graphs illustrate the price gains we saw this past year.
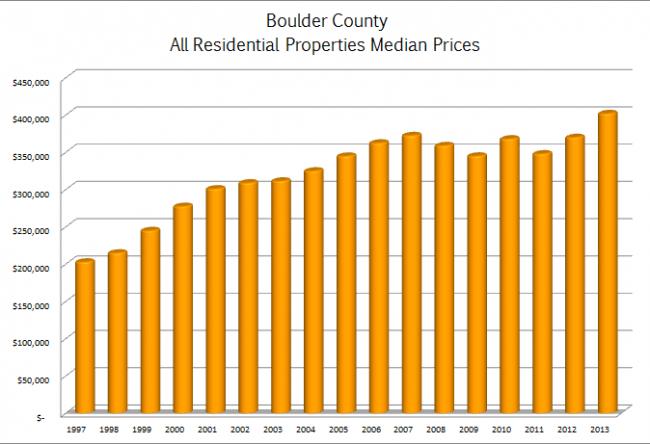
Median prices in Boulder County are at an all time high.

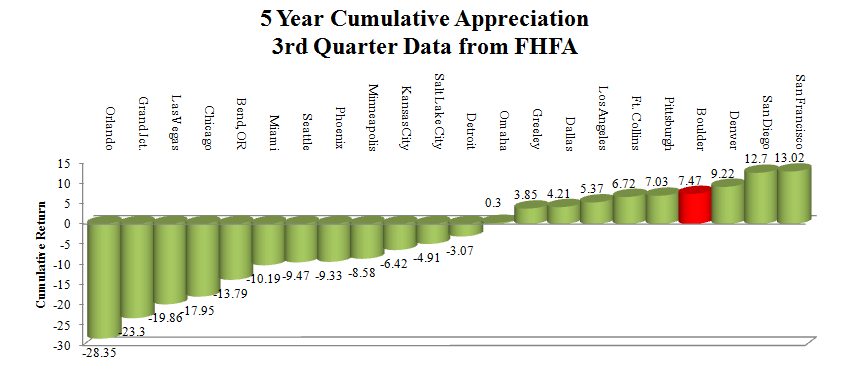
Through the 3rd quarter Boulder County’s appreciation (FHFA.gov) was up 8.11%.

This graph shows cumulative price appreciation over the past five years.

by Neil Kearney | Jan 14, 2014 | Boulder County Housing Trends, Statistics
 The sales in December showed an unexpected 12% increase. There were 330 sales (residential, Boulder County) in December 2013 and there were 295 sales in December of 2012.
The most notable statistic for the month is the total inventory. The number of available homes for sale has fallen from 1,507 at the end of 2011 to 946 at the end of 2013. One would expect that we would start seeing more new listings this time of year but we have much ground to make up in order to meet the buyer demand. The market keeps turning.
The slideshow below presents total sales, under contract percentage, inventory, sales by week, new listings and under contract by week.

by Neil Kearney | Dec 18, 2013 | Boulder County Housing Trends, Statistics
Yesterday I reported on the market increases in the luxury segment of the Boulder County real estate market. Today I’m going to give an update on the sales so far in 2013 for homes that have sold for less than $1,000,000.
Sales of homes under $1 million represent 96% of the sales and are up by 9% so far this year. As I discussed in my previous post luxury sales are up 34%.
Breaking down this large category into smaller chunks is helpful.
Sales $250,000 and under
2011 = 1,537 2012 = 1,705 2013 = 1,663
Prices have risen throughout Boulder County this year and this has made inexpensive homes hard to find. This price range is the only price range to have seen a decrease in sales this year. Sales in the price range of $0 – $250,000 represent 31.5% of the market and closings are down 2.5% so far this year.
Sales between $250,000 and $500,000
2011 = 1,583 2012 = 2,053 2013 = 2,266
Sales between $250,000 and $500,000 represent 43% of the closings so far this year and have seen an increase in activity by 10.4%.
Sales between $500,000 and $750,000
2011 = 487 2012 = 644 2013 = 833
Sales between $500,000 and $750,000 represent 16% of the closings so far this year and have seen an increase in activity by 29%.
Sales between $750,000 and $1,000,000
2011 = 149 2012 = 218 2013 = 283
Sales between $750,000 and $1,000,000 represent .5% of the closings so far this year and have seen an increase in activity by 30%.
The graph below shows the trends over three years. The purple line represents the total sales under $1,000,000 for each year.
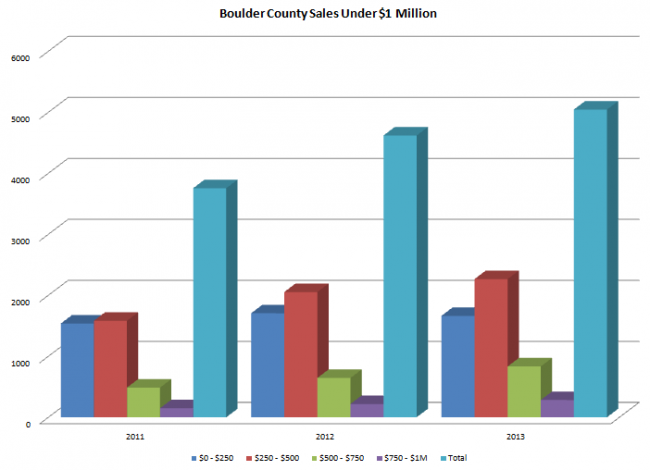
Note: All sales are YTD figures from January 1 through December 17th for each year.