by Neil Kearney | Dec 17, 2013 | Boulder County Housing Trends, Statistics
As of the end of November sales in all of Boulder County across all price ranges were up roughly 10%. This represents positive improvement and a second straight year of gains. However, that isn’t the entire story. In this post I’m going to dissect the numbers a bit and let you know where the most improvement has been seen. Keep in mind that I’m writing this in mid December and they are not year end numbers.
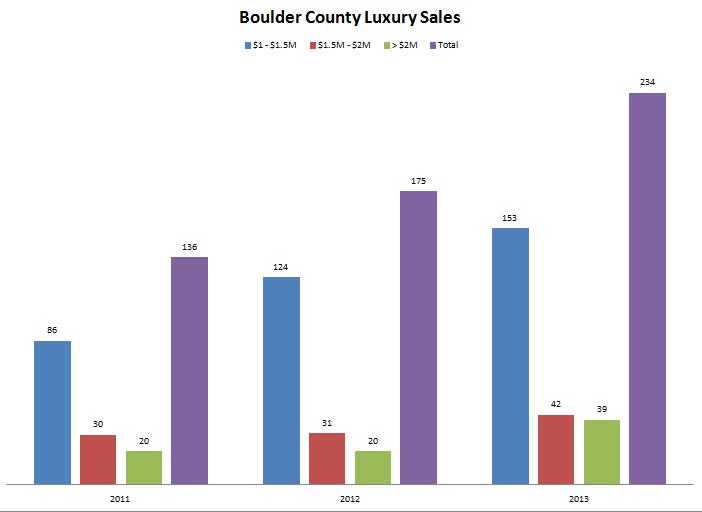
Boulder County has had an especially broad range of sales prices this year. Prices have ranged from $40,000 to over $6,000,000. During the recession years the luxury price range was especially hard hit. In 2007 there were 215 sales over $1,000,000 in the county. In 2010 that number had fallen 38% to 133 homes sold. So far in 2013 there have been 234 sales, a record number of sales in the luxury sector.
Sales in the $1,000,000 to $1,500,000 Price Range
2011= 86 2012= 124 2013= 153
Of the 234 total luxury sales, 153 were homes that sold between $1 and $1.5 million. This represents a 23% increase from the number sold last year.
Sales in the $1,500,000 to $2,000,000 Price Range
2011= 30 2012= 31 2013= 42
The 42 sales between $1.5 and $2 million represented a 35% increase from last year.
Boulder County Sales above $2,000,000
2011= 20 2012= 20 2013= 39
This sector showed the largest improvement, a 95% increase from 2012.
The chart below shows the change in luxury sales over the past three years. The purple bar shows the total sales per year over $1 million.

If you are looking for more information on this subject you may be interested in this article that ran yesterday in the Daily Camera http://www.dailycamera.com/boulder-business/ci_24720222/luxury-home-sales-boom-boulder-county-Colorado

by Neil Kearney | Dec 10, 2013 | Boulder County Housing Trends, Statistics
Sales took a big drop in November. Down 8.4% from last November and down 12% from October. After 21 straight months of increased year-over-year sales we have now had two straight months of decline.
Year-to-date sales are still up 9.6%.
Inventory, or lack thereof, continues to be a challenge. At the end of October there were just 1440 total listings on the market (single family and condos). This is down from 1818 just two months ago.
We are like a two cylinder car running on full capacity, however we are, figuratively speaking, topping out at just 45 mph. In order to have the market moving forward in 2014 we need to run on 8 cylinders with plenty of gas. We have the capacity all we need are the listings. I suspect the first six months of 2014 will be especially busy. If you are considering selling your house give me a call now so that we can discuss the timing, pricing and getting your house ready to go.
View the slideshow below to see all of the details.

by Neil Kearney | Nov 13, 2013 | Boulder County Housing Trends, Statistics
The Boulder County real estate market is predictably starting to slow as we get nearer the holidays. For the first month this year sales were lower in October (by just 1%) than they were a year ago. Inventory continues to fall. There are currently 31% fewer listings than there were at the same time two years ago. Sales for the first ten months of 2013 are up just over 11% however I expect this number to fall before the end of the year. Last year we had a very strong fall and winter with sales actually increasing during the fall months and this year we are seeing a normal pattern of declining sales as we near the end of the year.
The slide presentation below shows the current statistics compared with the last four years of data on a monthly basis.

by Neil Kearney | Oct 30, 2013 | Statistics
 I’ve just published The Kearney Report for the 3rd quarter. The report highlights the quarterly statistics in Boulder County as a whole and then broken down into smaller segments including, the City of Boulder, East County (Louisville, Lafayette, Superior, Erie), Gunbarrel and Longmont. To view, download or print the report click this link. Kearney Report 3rd quarter 2013
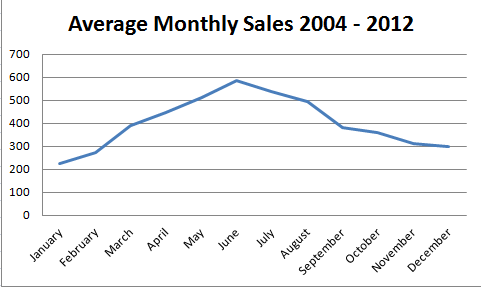
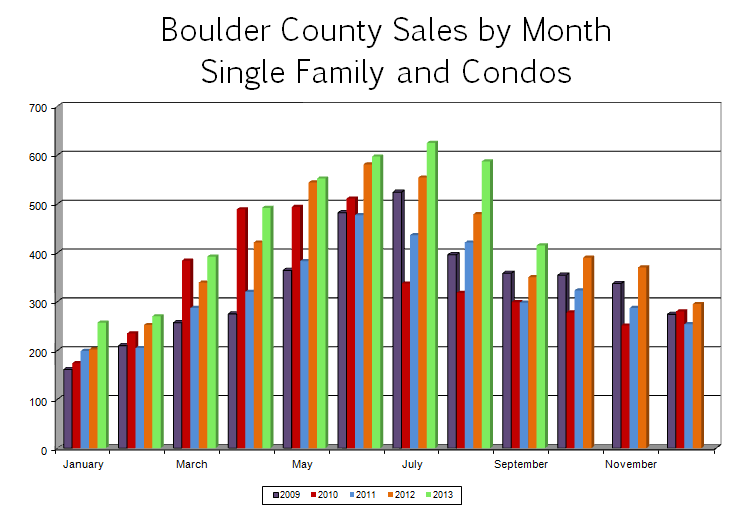
If you have been reading this report for quite some time you will know that there is some seasonality in the local real estate market. Usually we see the fewest number of sales in December and January, sales peak in June or July and the rest of the year falls into a neat and clean bell curve (see the first attached chart). Even though it is true that almost every year fits this pattern some years we see variation for different reasons. For example, in 2010 the Federal Government gave first time home buyers a tax credit of $7,000 if they would purchase a home by a certain date. This outside stimulus effected the shape of our overall market. This year the curve (green bars in the second chart) has a few wrinkles that are interesting. Among other topics I will talk about those wrinkles and see if those allow us to predict what will happen next. The report that follows is a detailed presentation of the sales statistics from the last quarter.
 The year started well, buyers were out in force but there were few sellers. It was like an army having a full compliment of the needed weapons but only half a shipment of ammunition. Everything works as designed, but you just can’t fire the gun as often as you would like. And so it was with home buyers early in the year, lots of them, with very few listings to buy. As a result, the market got off to a slower than predicted start. Once sellers realized that they were needed and that they would be compensated for selling, our market flourished. From March until July the market followed a nice upward curve. In August sales predictably fell to a level similar to June. A nice stair step down. Then in September, instead of dropping to a level roughly even with May, it fell to a level most similar to March. What happened? A few factors contributed to the drop. The first factor is the fact that most buyers who had confidence in the market and wanted to buy before interest rates increased have already done so. A second reason is the school factor, many buyers want to be in place by the time school starts so they rush to make the sale happen by the end of August. The last reason was a minor cause in September but may have implications in the coming months, the flooding.
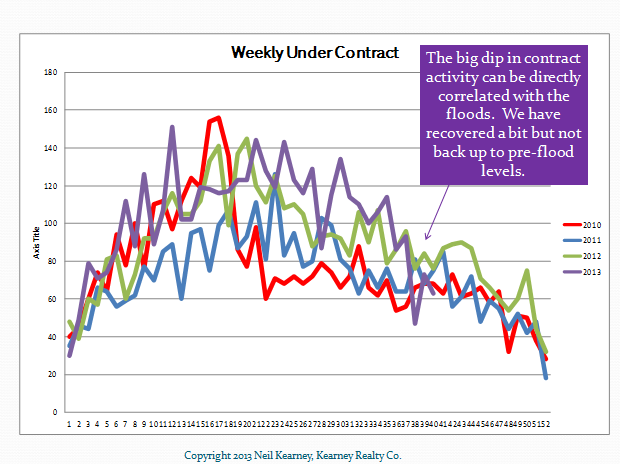
In mid-September the real estate market paused for a week or so while record amounts of rain fell and caused widespread flooding. The flooding caused not only a lost week in sales and listing activity; it caused major property damage, mostly in the form of flooded basements. Many pending sales were affected as damage was assessed. Easier to measure was the affect of the floods on the inventory of available homes. During the month of September the number of active homes decreased by 17% while a year ago during the same month, our inventory increased by 4%. Many homes that were on the market sustained damage and were forced off the market and others who would have normally listed their homes concentrated on cleanup rather than last minute polishing before listing their homes. We have since recovered to a normal level of new listings, but I suspect that the ripples from the flooding and it’s affects on sales volume and values won’t fully be seen for some time.
As we move into the fourth quarter we see the market slowing as we approach the holidays. This time of year many people start formulating their plans for the coming year and the factors that we are looking at which could affect the real estate market in 2014 are interest rate movement, job growth and how government posturing affects financing and transaction management. As always, if you are considering a move in the coming year it’s not too early to start our conversation.
by Neil Kearney | Oct 7, 2013 | Boulder County Housing Trends, Statistics
September was a very interesting month for the Boulder real estate market. Sales were strong, but the mid-month flooding definitely broke some momentum in the local home market. Sales of all residential properties increased by 18.6% over September of 2012 and this stretched our year-to-date increase to 12.5%. At the end of the month the percentage of homes that were under contract fell roughly 3 points from a month ago to 26%. This was all good and strong information.
Flooding hit the area starting September 12th and during the next week we saw very little activity in the real estate market. Many homes that had water damage that were on the market were pulled from the market and those that might have come on the market during September didn’t as owners cleaned up and fixed up as needed. The inventory of single family homes on the market in Boulder County dropped 24% from August 31st to September 30th.
As mentioned above the percentage of homes that are under contract fell just three points as compared to last month. However, the gross number of homes that went under contract during the month fell by a significant 25%. Since the number of homes on the market decreased at roughly the same pace of the fall in contracts the overall “under contract %” doesn’t jump out at you until you take a closer look.
To view all of the statistical graphs with my annotations click on the slideshow below.

by Neil Kearney | Sep 11, 2013 | Boulder County Housing Trends, Statistics
Sales were strong again in Boulder County in August. In fact there were 23% more closings this year than there were during August of last year. Year-to-date sales have increased roughly 12%. Sales peaked in July this year with 625 closings throughout the county. In August 587 properties closed which is just 10 units below June.
The current under contract percentage is hovering at 30%. Still a good indication of a strong market but interestingly, this is the first month since May of 2011 where we saw the previous year outpace the current month. Maybe a sign of a slowing market.
Inventory has been gradually increasing since March but we are still 12% the inventory levels of a year ago.
To get a full visual picture of the market please view the slideshow below.