
Yesterday I reported on the market increases in the luxury segment of the Boulder County real estate market. Today I’m going to give an update on the sales so far in 2013 for homes that have sold for less than $1,000,000.
Sales of homes under $1 million represent 96% of the sales and are up by 9% so far this year. As I discussed in my previous post luxury sales are up 34%.
Breaking down this large category into smaller chunks is helpful.
Sales $250,000 and under
2011 = 1,537 2012 = 1,705 2013 = 1,663
Prices have risen throughout Boulder County this year and this has made inexpensive homes hard to find. This price range is the only price range to have seen a decrease in sales this year. Sales in the price range of $0 – $250,000 represent 31.5% of the market and closings are down 2.5% so far this year.
Sales between $250,000 and $500,000
2011 = 1,583 2012 = 2,053 2013 = 2,266
Sales between $250,000 and $500,000 represent 43% of the closings so far this year and have seen an increase in activity by 10.4%.
Sales between $500,000 and $750,000
2011 = 487 2012 = 644 2013 = 833
Sales between $500,000 and $750,000 represent 16% of the closings so far this year and have seen an increase in activity by 29%.
Sales between $750,000 and $1,000,000
2011 = 149 2012 = 218 2013 = 283
Sales between $750,000 and $1,000,000 represent .5% of the closings so far this year and have seen an increase in activity by 30%.
The graph below shows the trends over three years. The purple line represents the total sales under $1,000,000 for each year.
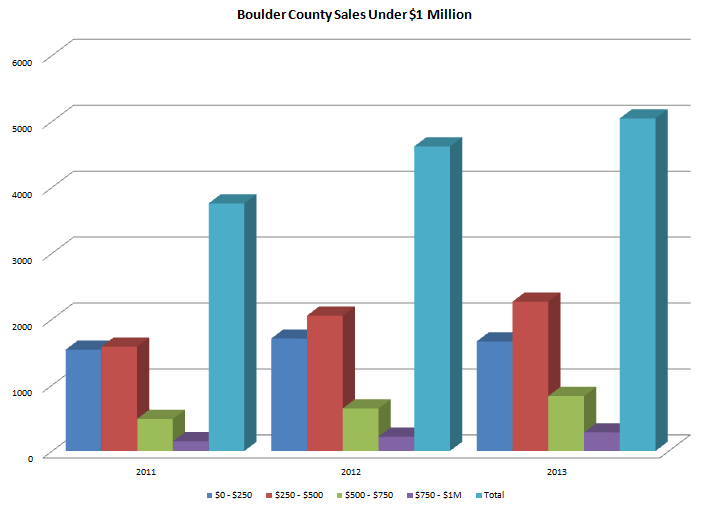
Note: All sales are YTD figures from January 1 through December 17th for each year.

