by Neil Kearney | Apr 8, 2013 | Boulder County Housing Trends, Statistics
The Boulder area real estate market has been very interesting to track lately. The major themes over the past months have been:
- Low inventory
- High buyer demand
- Positive price pressure
- Homes selling quickly (see first two items above)
During March these trends continued. During March there were 392 sales of residential properties in Boulder County. This represented a 15.6% increase from March 2012. Sales so far in 2013 are up 16% compared to last year.
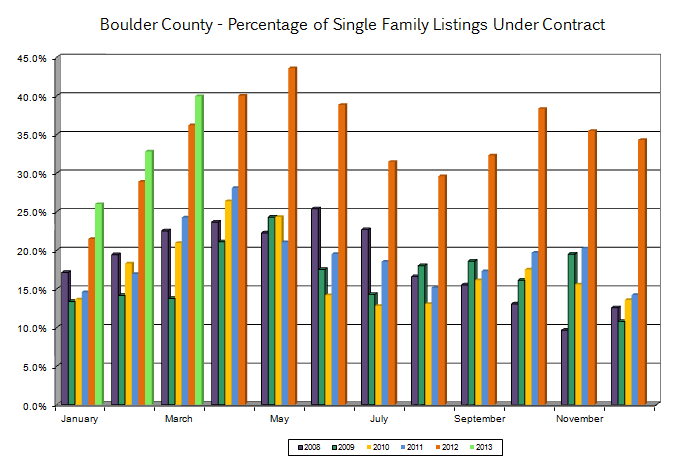
Available inventory is down from a year ago. Last year at this time we had 1,382 homes on the market that were not already under contract, this year we have just 818. This translates into an under contract percentage of 40%. Here are a few graphs that are taken from the slideshow below. The first one shows the active inventory by month over the past seven years and the second one shows the under contract percentage for single family homes in Boulder County by month over the past six years.


The slideshow below gives a comprehensive look at the Boulder County real estate market.

by Neil Kearney | Feb 13, 2013 | Boulder County Housing Trends, Statistics
Real estate sales in Boulder County continued the strong trend which began last year. Sales were up 27% in the first month of the year. Helping the sales numbers was a jump in available inventory. As of the end of January the number of homes on the market equaled last year. We will need to continue to add new listings to keep the market strong into the spring.
Interest rates have gone up a bit lately and I’m sure that has something to do with the early activity in the market. Also helping the market this January and February is unseasonably good weather. I noticed my bulbs are starting to sprout in the front yard. Where is winter this year? The attached slideshow shows the activity in the market for the month.
by Neil Kearney | Feb 8, 2013 | Boulder County Housing Trends, Statistics
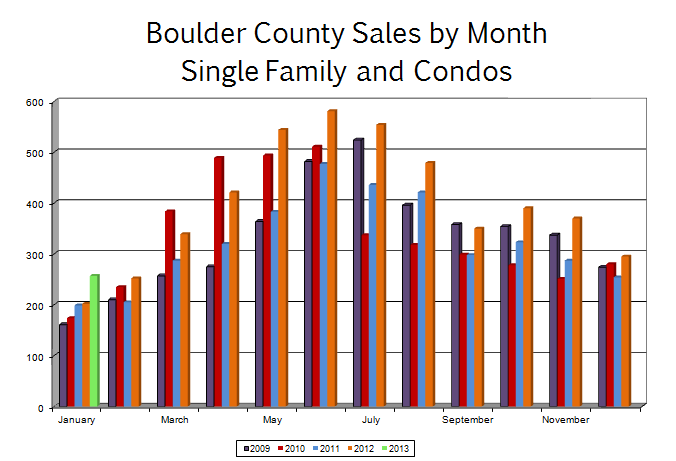
As I mentioned before, 2012 was a rebound year. The activity in the Boulder area real estate market was consistently strong throughout the year. If January is any indication, the trend is continuing. Sales in January were up 27% from last January. The first chart below shows the sales activity by month over the past five years.

Taking it one step further, the chart below shows the sales that closed in Boulder County on a weekly basis over the past four years. The purple line shows the closings over the four weeks of January and the strength in the market is clearly visable. Remember that the normal time between contract and closing is roughly 30 to 45 days so the buyers were picking out these homes in November and December.

Going forward here is what I see. I predict that we will continue to gain needed inventory (we are just about where we were a year ago) and the market will continue to be strong throughout the spring.
In the world of finance there is the Purchasing Managers Index. This is an indicator of economic activity that gives the world a good idea where the economy in the United States is heading. For the real estate market we have the Pending Sales Index. For our local market the best we can do is track the number of properties that are under contract. I have been doing this for quite some time. Every Thursday morning at 8:30 I run a saved search that gives me the number of new listings that have hit the market, the number of sales and the number of homes that have gone under contract. Using this I can get a sneak peak on how the numbers are going to look in the future. Right now (see below) we are in full gear and tracking a bit ahead of past years.

by Neil Kearney | Jan 21, 2013 | Boulder County Housing Trends, Statistics
We take pride in following and reporting on the local real estate market on an ongoing basis. The end of the year is a great time to pull together the trends and give the real estate market a comprehensive look. The Kearney Report contains sales data across Boulder county and includes charts and explanations about; total sales, median prices, sales by price range, sales by zip code and sales by type.
2012 was a good year. Sales increased by 23%, prices increased and inventory of available homes decreased. The 19 page report quickly lets the reader understand the local real estate market. Our goal at Kearney Realty is to empower our clients by giving them solid information from which they can make a good decision. Click here to view the entire report. No login required!
by Neil Kearney | Jan 17, 2013 | Boulder County Housing Trends, Statistics
Since the trap door fell out on the national economy, the housing market has been wallowing in a dark cellar looking for sparks of optimism from which to ignite. This past year the sparks caught and the housing market began it’s path toward recovery. Today I will begin highlight a few of the more interesting statistics for the year. To get a full view of what is happening in the different market segments, I encourage you to get a copy of The Kearney Report (to be released soon) and study the graphs and explanations included therein.

The number of residential properties that sold in Boulder County was up 23% during the year. On a monthly basis, each months sales eclipsed the sales of the same month in 2011 so it was a consistent recovery not one weighted to either end of the year. After five years of stagnant to slightly negative appreciation we saw once again prices of homes rising. This was especially true as we closed the year. Many factors go into home price trends but the largest factor locally was basic supply and demand. As the year progressed the activity in the market remained strong but the number of homes on the market dwindled. By the end of the year the number of active homes on the market was down to about half as many as were on the market at the same time in 2009. This competition for good listings is leading to multiple offers and upward pressure on prices.

Low interest rates are definitely a driving factor in buyer demand. The affordability of homes (total monthly outlay compared to income) is at a historically high rate. That is when a buyer purchases a home now they can afford more home because the prices have not been rising with inflation and the interest charges are way down. Add to this the tight rental market where rents have been rising and good properties have been hard to find, and you get a really strong environment for buying homes.
The market is off to a strong start this year. All indications show that we will have good buyer demand. The only unknown variable is if we will have an ample supply of homes on the market. If you have been thinking about selling but have been putting it off, we would love to explore that possibility with you and let you know if it makes sense for you.


