by Neil Kearney | Dec 10, 2013 | Boulder County Housing Trends, Statistics
Sales took a big drop in November. Down 8.4% from last November and down 12% from October. After 21 straight months of increased year-over-year sales we have now had two straight months of decline.
Year-to-date sales are still up 9.6%.
Inventory, or lack thereof, continues to be a challenge. At the end of October there were just 1440 total listings on the market (single family and condos). This is down from 1818 just two months ago.
We are like a two cylinder car running on full capacity, however we are, figuratively speaking, topping out at just 45 mph. In order to have the market moving forward in 2014 we need to run on 8 cylinders with plenty of gas. We have the capacity all we need are the listings. I suspect the first six months of 2014 will be especially busy. If you are considering selling your house give me a call now so that we can discuss the timing, pricing and getting your house ready to go.
View the slideshow below to see all of the details.

by Neil Kearney | Sep 11, 2013 | Boulder County Housing Trends, Statistics
Sales were strong again in Boulder County in August. In fact there were 23% more closings this year than there were during August of last year. Year-to-date sales have increased roughly 12%. Sales peaked in July this year with 625 closings throughout the county. In August 587 properties closed which is just 10 units below June.
The current under contract percentage is hovering at 30%. Still a good indication of a strong market but interestingly, this is the first month since May of 2011 where we saw the previous year outpace the current month. Maybe a sign of a slowing market.
Inventory has been gradually increasing since March but we are still 12% the inventory levels of a year ago.
To get a full visual picture of the market please view the slideshow below.
by Neil Kearney | Aug 22, 2013 | Boulder County Housing Trends, Statistics
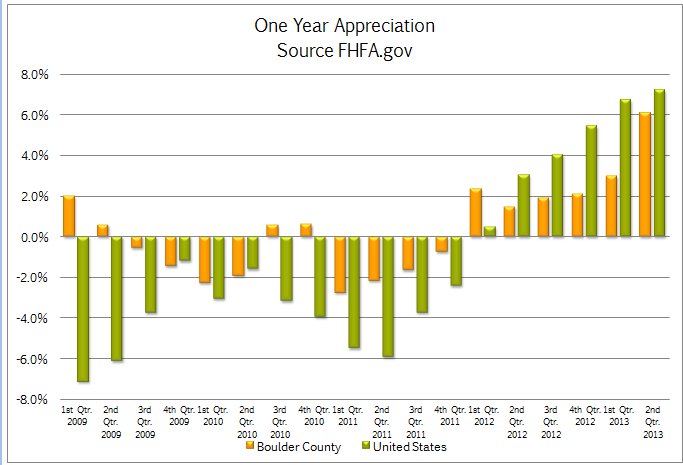
The FHFA.gov Home Price Index was released today and it reported that homes in Boulder County increased in value by 6.06% for the 12 months ending June 30, 2013. During the second quarter alone the home appreciation rate was 2.71%. The annual rate of 6.06% was below the national average of 7.22% but our area was still ranked as 63rd best out of the nearly 300 MSA (Metropolitan Statistical Areas) tracked. The areas that had the most appreciation over the past year were for the most part the areas that were most affected during the most recent recession. These areas included Stockton CA +19.4%, Phoenix AZ +18.47%, Las Vegas NV +17.59%, Bend OR +16.73% and Modesto CA +16.01%. Over the past five years Boulder County has seen overall appreciation of 3.72%. This compares to -4.35% for the United States as a whole. The areas that are showing the most appreciation currently are all still recovering. The areas I just mentioned that have the highest current rate of appreciation are all negative over the past five years. Stockton CA – 18.99%, Phoenix AZ – 24.85%, Las Vegas NV – 38.84%, Bend OR -27.20% and Modesto CA -25.16%. In fact the only area in the current top 20 with a positive 5 year return is Bismarck ND with a one year return of 14.07% and a five year gain of 28.75%. The chart below shows the comparative appreciation rates of Boulder County to the United States as a whole.  The areas that are still lagging and are showing negative home appreciation tend to be in the South, and the rust belt. Here is a list of the bottom 10 markets as measured by FHFA.gov.
- Norwich CT – 3.36% (1 year), -19.6% (5 year)
- Gulfport MS -3.23%, -21.59%
- Rockford IL -2.67%, -19.82%
- Mobile AL -2.63%, -18.91%
- Fayetteville AL -1.77%, -3.47%
- Huntington/Ashland WV, KY, OH -1.71%, +.98%
- Huntsville AL -1.6%, -4.24%
- Scranton PA -1.59%, -6.04%
- Decatur IL -1.38%, -2.45%
- Toledo OH -1.16%, -13.65%

by Neil Kearney | Jul 17, 2013 | Boulder County Housing Trends, Boulder Real Estate, Statistics
Boulder County Real Estate Statistics June 2013 from Neil Kearney
Sales in Boulder County slowed a bit in June but year-to-date sales are still up 9.4%. Prices are up and inventory is still low. Last year sales peaked in June and this year we may be following suit. Spring tends to be the busiest time of year and the number of buyers in the market usually sees a drop by the end of June.
In the slide show you will see a graph showing the number of homes that went under contract on a weekly basis over the past four years. During the week between July 4th and July 11th there was a huge drop in new accepted contracts. I wonder if this is a trend caused by an increase in interest rates or if it is a blip caused by vacation schedules?