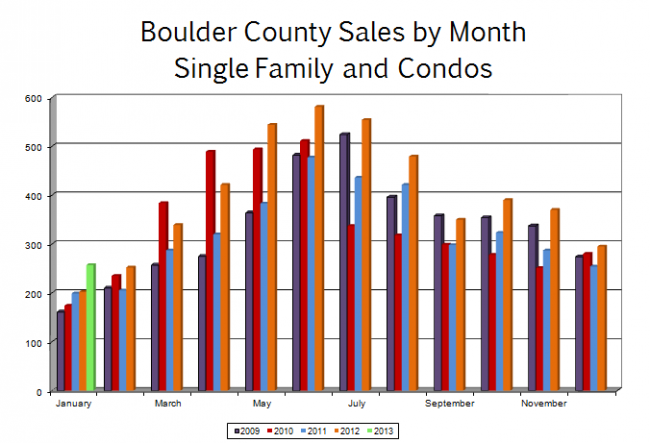
As I mentioned before, 2012 was a rebound year. The activity in the Boulder area real estate market was consistently strong throughout the year. If January is any indication, the trend is continuing. Sales in January were up 27% from last January. The first chart below shows the sales activity by month over the past five years.

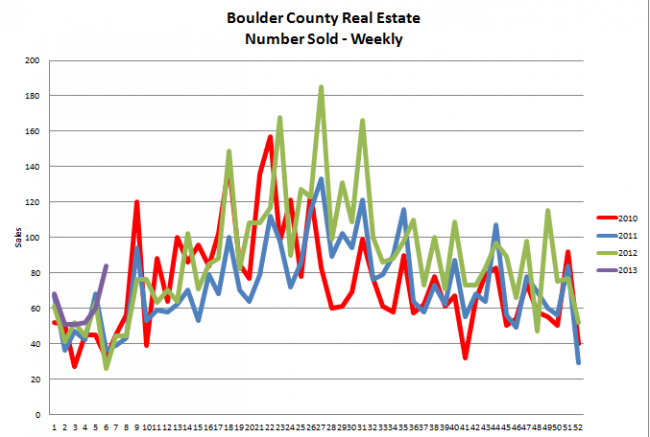
Taking it one step further, the chart below shows the sales that closed in Boulder County on a weekly basis over the past four years. The purple line shows the closings over the four weeks of January and the strength in the market is clearly visable. Remember that the normal time between contract and closing is roughly 30 to 45 days so the buyers were picking out these homes in November and December.
Going forward here is what I see. I predict that we will continue to gain needed inventory (we are just about where we were a year ago) and the market will continue to be strong throughout the spring.
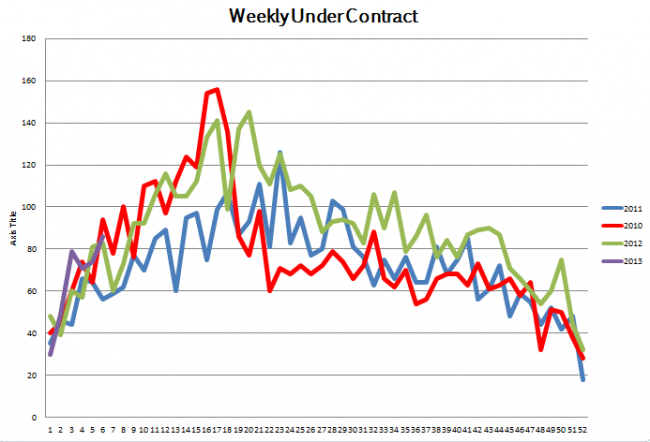
In the world of finance there is the Purchasing Managers Index. This is an indicator of economic activity that gives the world a good idea where the economy in the United States is heading. For the real estate market we have the Pending Sales Index. For our local market the best we can do is track the number of properties that are under contract. I have been doing this for quite some time. Every Thursday morning at 8:30 I run a saved search that gives me the number of new listings that have hit the market, the number of sales and the number of homes that have gone under contract. Using this I can get a sneak peak on how the numbers are going to look in the future. Right now (see below) we are in full gear and tracking a bit ahead of past years.


