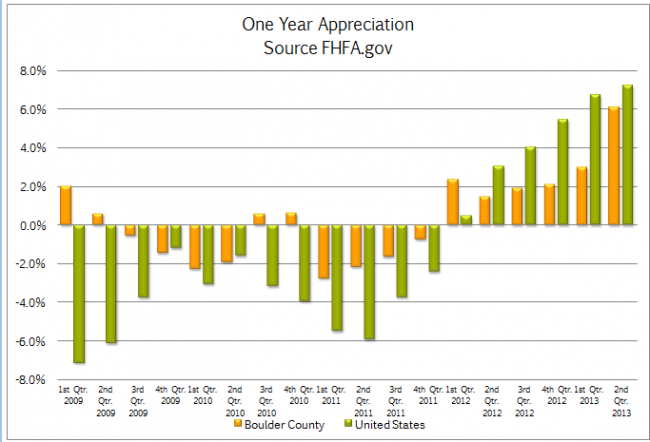
The FHFA.gov Home Price Index was released today and it reported that homes in Boulder County increased in value by 6.06% for the 12 months ending June 30, 2013. During the second quarter alone the home appreciation rate was 2.71%. The annual rate of 6.06% was below the national average of 7.22% but our area was still ranked as 63rd best out of the nearly 300 MSA (Metropolitan Statistical Areas) tracked. The areas that had the most appreciation over the past year were for the most part the areas that were most affected during the most recent recession. These areas included Stockton CA +19.4%, Phoenix AZ +18.47%, Las Vegas NV +17.59%, Bend OR +16.73% and Modesto CA +16.01%. Over the past five years Boulder County has seen overall appreciation of 3.72%. This compares to -4.35% for the United States as a whole. The areas that are showing the most appreciation currently are all still recovering. The areas I just mentioned that have the highest current rate of appreciation are all negative over the past five years. Stockton CA – 18.99%, Phoenix AZ – 24.85%, Las Vegas NV – 38.84%, Bend OR -27.20% and Modesto CA -25.16%. In fact the only area in the current top 20 with a positive 5 year return is Bismarck ND with a one year return of 14.07% and a five year gain of 28.75%. The chart below shows the comparative appreciation rates of Boulder County to the United States as a whole.  The areas that are still lagging and are showing negative home appreciation tend to be in the South, and the rust belt. Here is a list of the bottom 10 markets as measured by FHFA.gov.
- Norwich CT – 3.36% (1 year), -19.6% (5 year)
- Gulfport MS -3.23%, -21.59%
- Rockford IL -2.67%, -19.82%
- Mobile AL -2.63%, -18.91%
- Fayetteville AL -1.77%, -3.47%
- Huntington/Ashland WV, KY, OH -1.71%, +.98%
- Huntsville AL -1.6%, -4.24%
- Scranton PA -1.59%, -6.04%
- Decatur IL -1.38%, -2.45%
- Toledo OH -1.16%, -13.65%


