by Neil Kearney | Sep 25, 2014 | Boulder County Housing Trends, Statistics
It was clear that prices were rising this spring. There were tons of homes selling for full price or above and it seemed each sale was breaking new territory. Buyers felt it as “that one” deal got away and never came back around. Sellers felt it as they sold for higher than the had imagined just months earlier. But this is all anecdotal. Hard figures were hard to find and month to month numbers are much too volatile to be trusted. I’ve been tracking the FHFA.gov home price statistics quarterly since 2006 and they give a stable platform from which to compare prices. Not only in our market but across the county. Here are the latest home appreciation results from the second quarter of 2014.
For the one year period ending June 30th homes on average increased in value by 9.6%. This is the highest figure since 2006 and ranked us 55th highest out of the largest 276 metropolitan areas. During the second quarter the appreciation rate in our market was 3.81%. This ranked 33rd highest nationally. Since the 2nd quarter of 2008 homes in our market have appreciated on average 13.7%. This is 21st best in the nation. The chart below shows the rolling one year appreciation of Boulder County compared to the United States as a whole over the past five years.
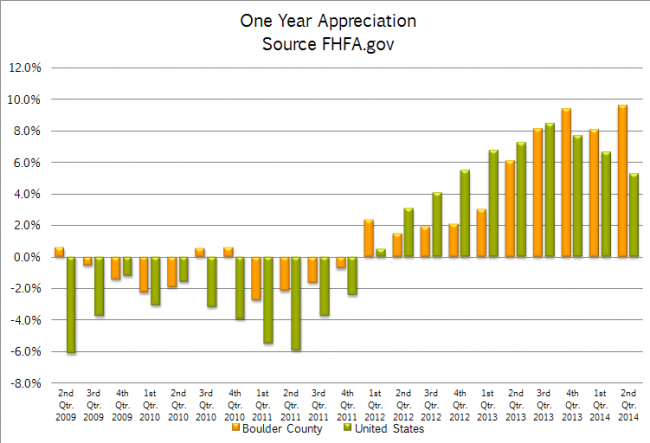
The one year appreciation in the United States as a whole has slowed a bit but at 5.25% is still historically quite strong. However during the second quarter the appreciation was just .81%. Over the last five years the national housing stock has appreciated in value by 8.25%.
The top states for home appreciation right now are; Nevada (14.8%), California (11.38%), District of Columbia (10.74%), North Dakota (8.68%) and Arizona (8.39%). Colorado ranks 8th with 7.76%. The states that rank lowest in home appreciation are Mississippi (-.51%), Connecticut (.29%), Alaska (.34%), Delaware (1.13%), and Virginia (1.24%).
The top Metropolitan Areas for home appreciation are all in California and all showed gains in the 22 – 25% range. These are the same areas that were hit the hardest during the economic and housing crisis but now have recovered and are now positive for the five year period. The areas that have the lowest appreciation (-3.5 to -2%) are located in Ohio, Wisconsin, New Jersey, Illinois, and New Mexico.

by Neil Kearney | Apr 28, 2014 | For Buyers, General Real Estate Advice
 The Boulder real estate market is currently characterized by low inventory and good buyer demand. It’s a sellers market. Many home buyers are finding that the houses that they are interested in buying are also coveted by other buyers. This leads to a multiple offer situation. A great situation to be in – if you are a seller. For a buyer it really stinks. To see the situation from both sides read this article.
In our area multiple offers are most often handled in this way. The listing agent receives an offer and then lets all other agents who are showing or have showed the house know that they will be presenting the offer at a certain time and day. If another offer does come in the first offering party is advised of the second offer and is offered the opportunity to revise their offer. For the buyer the information available is usually only limited to the number of offers that will be looked at. This information gap leads to much anxiety. How much should we offer? What are the other offers? Are we crazy to offer $X? Will there be another better house coming down the line that is less hassle and not priced so high? Will it appraise if we go over full price? It goes on and on and each of these questions are rhetorical.
Since I can’t answer these questions for my clients with any clarity. I rely on experience to advise them the best I can and ultimately I leave it up to them to pick a number. Sometimes we use an escalation clause to calm the anxiety a bit and to hedge an overpriced offer. In the end it’s an inexact science and the results favor the bold.
So far this year there have been approximately 362 sales in the City of Boulder. In 23% of these transactions the buyer paid more than the listing price for the property. Presumably most of these 84 transactions had multiple offers. So in an effort to bring some data to the unanswerable here are the statistics from those multiple offer situations.
- The average successful offer over all price ranges exceeded the listing price by 3.07%.
- The highest percentage paid over the list price was 12.63%.
- The average price paid over list in transactions under $300,000 was 3.13%
- The average price paid over list in transactions between $300,000 and $600,000 was 2.72%.
- The average price paid over list in transactions between $600,000 and $800,000 was 2.65%
- The average price paid over list in transactions over $800,000 was 4.63% (3.8% if you exclude
- In 14 of the 84 transactions the buyer paid $2,000 or less over list price.
- The average premium paid across all price ranges was $15,500.
by Neil Kearney | Feb 14, 2014 | Boulder County Housing Trends, Statistics
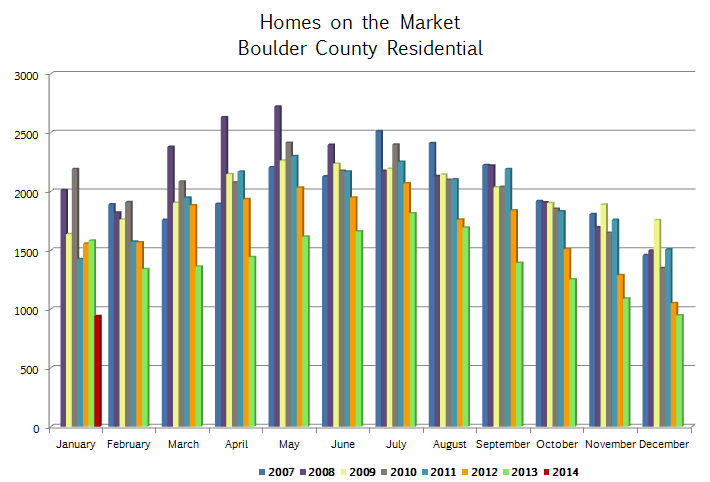
This year, the real estate market in Boulder County is getting off to a measured start. Sales were down 15% compared to last year during the month. Given that last year we were off to such a quick start, this is not too surprising. But what is concerning is the continuing trend of low inventory. The graph below shows the current (as of January 31st) inventory of available listings in Boulder County over the past six years. The current month is represented by the short red stick on the left hand side. If you are a buyer the pickin’s are pretty slim.
To see more market statistics in detail please browse through the slideshow below.

by Neil Kearney | Nov 14, 2013 | Boulder County Housing Trends, General Real Estate Advice
An old adage in real estate is to buy property in the way of development. I’ve never really saw this clearly until a recent trip to Texas. My son and I were looking at colleges and our itinerary included a drive from San Antonio to Dallas. I have never spent much time in Texas so I was looking forward to seeing the countryside. Instead of an education on topography I got a major lesson on population growth with a minor in sprawl studies.
During our five hour drive I kept seeing a reoccurring pattern: city center, industrial area, mall, big box stores, strip malls, outlet mall. It was like a broken reel or an old time cartoon like Speed Racer where the action scenes show the characters driving past the same 6 buildings over and over again. I’d heard about the sprawl in huge cities like Houston but it seemed that along I-35 there was a constant stream of development. This got me thinking about whether investing in areas so far from the city core would be a good idea.
In my town, Boulder Colorado, the growth patterns have been unnaturally halted. There is a band of land between Boulder and its nearest neighbors where no development can take place. The City of Boulder isn’t annexing any land for development and Boulder County won’t approve any new subdivisions unless they are annexed. In addition the City and County have purchased tens of thousands of acres of rural and mountain land around Boulder as open space. This bubble has forced development east of town (can’t go west because of the mountains) to towns like Erie, Lafayette, Longmont and Broomfield. Thirty years ago would have been a great time to buy land in those areas.
We are fortunate to have an area that has a good economy, climate, and lifestyle. People want to live here, so the problem is managing population growth which includes housing, transportation and economic growth in a smart way. I would say that for the most part the foresight of our city leaders long ago has allowed us to maintain a good lifestyle, just with more people sharing.
Not all areas are as fortunate. The financial struggles of Detroit have been in the news lately. In 1950 there were over 1.8 million residents in Detroit now there are just over 700,000. Not only is this bad for the public coffers it is really bad for real estate investment. Simple supply and demand.
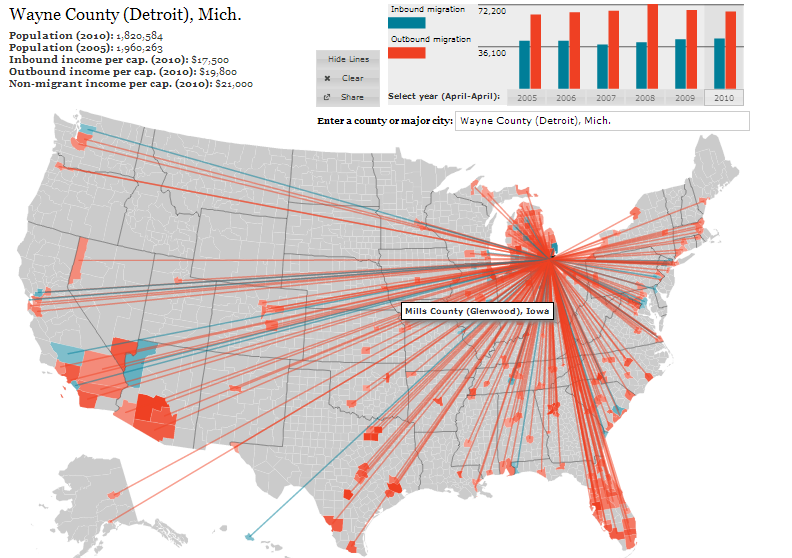
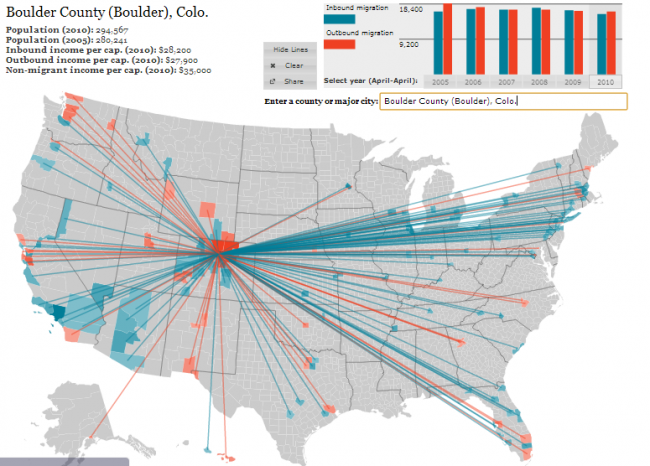
So if you are looking at investing in real estate it would be good to consider the population pattern of the area. Is it gaining or losing population? Luckily Forbes has put together a cool interactive map that uses US Census data to track population flow throughout the country. To view and use the map click here. All you need to do is to enter a county or a major city and the migration/immigration statistics will be displayed along with lines that indicate where people are coming from or where they are going to depending upon the pattern. Below are a few screen shots.
The first map shows the migration pattern for Boulder County. From 2005 to 2010 (last census data), Boulder County gained 14,326 people. A net increase of just under 5%. From the thick blue lines we can see that we have a strong contingent of new residents from the Eastern Seaboard.
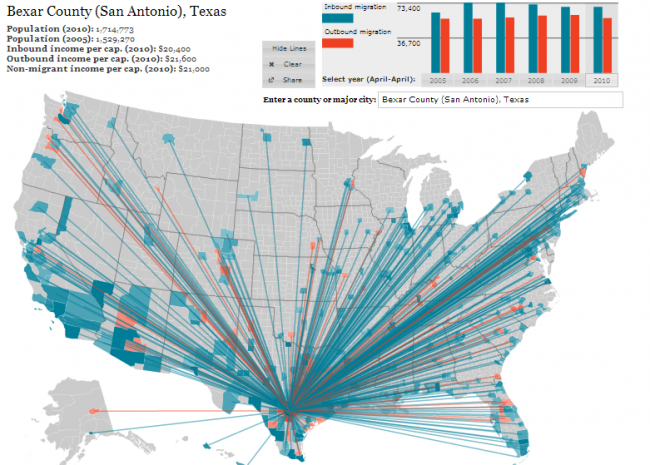
 The second map shows San Antonio Texas. Bexar County gained 185,503 residents between 2005 and 2010! An increase of nearly 11%. No wonder that I noticed the growth.
The last map I will show is for Detroit. I’ve already talked about the population declines, but here is how it has looked over the past five years. The red lines show people moving out. Wayne County has lost 7% of it’s population over the past five years. This continues a longer trend as I mentioned earlier.
 I would encourage you to play with the map. Put in your hometown. Put in areas like Phoenix and Las Vegas and Orlando. Then look at the rural Midwest. Once you become familiar with the trends think about how real estate values follow these trends. In the end you want to invest in an area that is gaining population. As a friend of mine says “the number of cheeks must match the number of seats”.

by Neil Kearney | Oct 30, 2013 | Statistics
 I’ve just published The Kearney Report for the 3rd quarter. The report highlights the quarterly statistics in Boulder County as a whole and then broken down into smaller segments including, the City of Boulder, East County (Louisville, Lafayette, Superior, Erie), Gunbarrel and Longmont. To view, download or print the report click this link. Kearney Report 3rd quarter 2013
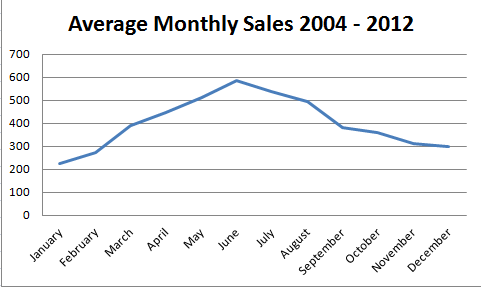
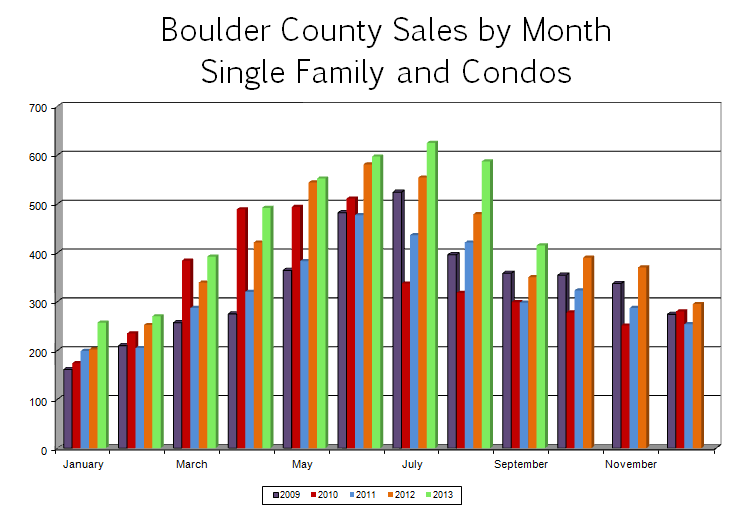
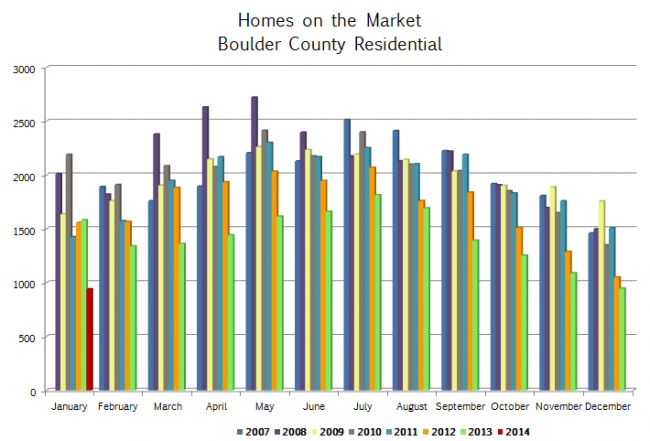
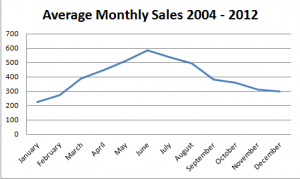
If you have been reading this report for quite some time you will know that there is some seasonality in the local real estate market. Usually we see the fewest number of sales in December and January, sales peak in June or July and the rest of the year falls into a neat and clean bell curve (see the first attached chart). Even though it is true that almost every year fits this pattern some years we see variation for different reasons. For example, in 2010 the Federal Government gave first time home buyers a tax credit of $7,000 if they would purchase a home by a certain date. This outside stimulus effected the shape of our overall market. This year the curve (green bars in the second chart) has a few wrinkles that are interesting. Among other topics I will talk about those wrinkles and see if those allow us to predict what will happen next. The report that follows is a detailed presentation of the sales statistics from the last quarter.
 The year started well, buyers were out in force but there were few sellers. It was like an army having a full compliment of the needed weapons but only half a shipment of ammunition. Everything works as designed, but you just can’t fire the gun as often as you would like. And so it was with home buyers early in the year, lots of them, with very few listings to buy. As a result, the market got off to a slower than predicted start. Once sellers realized that they were needed and that they would be compensated for selling, our market flourished. From March until July the market followed a nice upward curve. In August sales predictably fell to a level similar to June. A nice stair step down. Then in September, instead of dropping to a level roughly even with May, it fell to a level most similar to March. What happened? A few factors contributed to the drop. The first factor is the fact that most buyers who had confidence in the market and wanted to buy before interest rates increased have already done so. A second reason is the school factor, many buyers want to be in place by the time school starts so they rush to make the sale happen by the end of August. The last reason was a minor cause in September but may have implications in the coming months, the flooding.
In mid-September the real estate market paused for a week or so while record amounts of rain fell and caused widespread flooding. The flooding caused not only a lost week in sales and listing activity; it caused major property damage, mostly in the form of flooded basements. Many pending sales were affected as damage was assessed. Easier to measure was the affect of the floods on the inventory of available homes. During the month of September the number of active homes decreased by 17% while a year ago during the same month, our inventory increased by 4%. Many homes that were on the market sustained damage and were forced off the market and others who would have normally listed their homes concentrated on cleanup rather than last minute polishing before listing their homes. We have since recovered to a normal level of new listings, but I suspect that the ripples from the flooding and it’s affects on sales volume and values won’t fully be seen for some time.
As we move into the fourth quarter we see the market slowing as we approach the holidays. This time of year many people start formulating their plans for the coming year and the factors that we are looking at which could affect the real estate market in 2014 are interest rate movement, job growth and how government posturing affects financing and transaction management. As always, if you are considering a move in the coming year it’s not too early to start our conversation.