by Neil Kearney | Apr 19, 2013 | Boulder County Housing Trends, Statistics, Uncategorized
I’ve just finished The Kearney Report which summarizes the local real estate market in a colorful mostly graphical format. It is 17 pages of great statistical information for Boulder County real estate including breakout sections for Boulder, Gunbarrel, Longmont, and East County (Superior, Louisville, Lafayette, and Erie). To view the entire report click here.
Here are a few excerpts from the summary:
The local real estate market showed surprising strength through the holidays and soon after the calendar turned, buyers were out in force. Buyers currently have many reasons to purchase real estate. Some of the most compelling at the moment are; low interest rates, economic recovery, recognition that prices have bottomed out and are heading up, and increased buyer confidence (based upon the three previous reasons). These causes have had one effect on the local housing market, super high demand. Through the first quarter, sales in Boulder County are up 16% from a year ago and up 33% from the first quarter in 2011. The market is humming along!
It’s too soon to know how much prices have risen but so far this spring I have seen quite a few homes with prices that I thought were way too high go under contract very quickly. According to the latest FHFA.gov price appreciation report, prices in Boulder County had risen 2.08% for the year ending December 31, 2012. Anecdotally, I have seen some homes in some areas sell at levels approximately 15% higher than they would have been a year ago. We’ll see where the averages fall but it is definitely a sellers market.
Multiple offers are very common on homes that are in good condition and are asking a fair price. There is an urgency to make decisions and if a house lasts more than a week or two on the market it is most likely overpriced. A typical scenario right now is where a seller lists their home at a price level that is pushing the market (just to see if anyone will bite). They get 15-20 showings during the first week and then when no offers come in they start chasing the market with price reductions.
by Neil Kearney | Apr 8, 2013 | Boulder County Housing Trends, Statistics
The Boulder area real estate market has been very interesting to track lately. The major themes over the past months have been:
- Low inventory
- High buyer demand
- Positive price pressure
- Homes selling quickly (see first two items above)
During March these trends continued. During March there were 392 sales of residential properties in Boulder County. This represented a 15.6% increase from March 2012. Sales so far in 2013 are up 16% compared to last year.
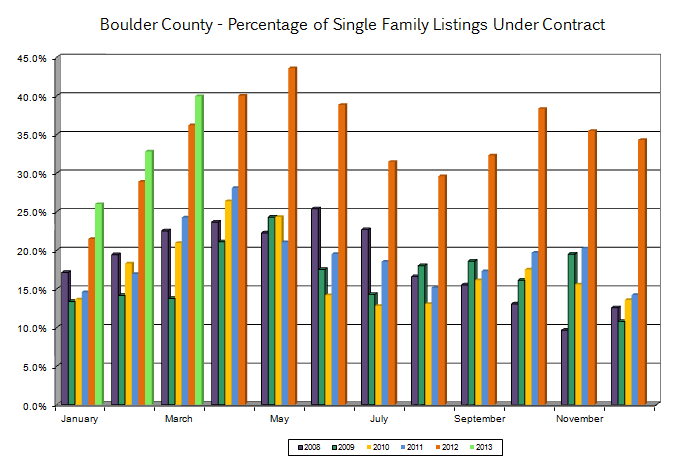
Available inventory is down from a year ago. Last year at this time we had 1,382 homes on the market that were not already under contract, this year we have just 818. This translates into an under contract percentage of 40%. Here are a few graphs that are taken from the slideshow below. The first one shows the active inventory by month over the past seven years and the second one shows the under contract percentage for single family homes in Boulder County by month over the past six years.


The slideshow below gives a comprehensive look at the Boulder County real estate market.
by Neil Kearney | Mar 13, 2013 | Boulder County Housing Trends, Statistics
The attached slideshow shows all of the details for the past month but some of the highlights of the Boulder County real estate market right now are:
- Dropping inventory
- High buyer demand
- Multiple offers
- High under contract percentage
When there is low inventory and high demand the result is always high competition for a scarce resource. What we have seen is multiple offers for well priced homes and lots of showings but no offers on obviously overpriced homes.
by Neil Kearney | Mar 12, 2013 | Boulder County Housing Trends, Featured, Statistics
As I outlined in a previous post the real estate market is really crazy right now. Due to the low inventory and some upward movement in interest rates buyers are swarming new listings as they come available. I am working closely with a number of buyers and as they see listings, I come prepared to give neighborhood sold data. This way if there is interest we can immediately assess whether the home is fairly priced on not. When you look at just one home at a time (quick while it’s still available!) it is hard to get a sense of how a particular home compares with other similar homes.
I have noticed that the market is speaking very quickly at the moment. If it is well priced it sells right away. If it has been on the market over a week it’s over priced. It is a bit of a game of chicken because I have noticed that some homes which seem to be overpriced are still going very quickly. These sales are then causing the next seller to list their home before. This is the perfect storm for price appreciation. And we are seeing it throughout Boulder County but especially in Boulder.
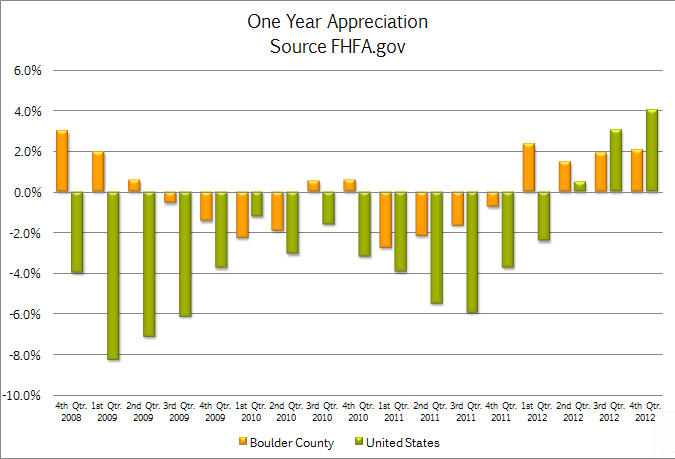
The FHFA recently released their home price index showing home appreciation throughout the country. Boulder County is one of 302 metropolitan statistical areas (MSA) that are tracked using loan data and same house sales. For the one year period ending December 31st, values in the United States, on average increased by 5.45%. In Colorado appreciation was measured at 10.69% for the same time frame and Boulder County’s came it at 2.08%. This ranked us 59th highest out of the 302 MSA’s. The chart below shows the US average and Boulder County’s appreciation over the past four years

The top areas for home appreciation over the past year were:
Bismarck, North Dakota – 13.41% (Fracking)
Phoenix, Arizona – 12.05% (bubble recovery)
Boise, ID – 8.27%
San Jose, CA – 6.86%

by Neil Kearney | Mar 1, 2013 | Boulder County Housing Trends, Statistics
To say the real estate market in Boulder is busy is an understatement. The market is red hot! New  listings are getting as much attention as piece of cheese at a mouse convention.
Here is some hard evidence which illustrates what is going on in the market. The list below shows the new listings that have come on the market in the city of Boulder priced under $600,000 over the past two weeks. As you can see there have been 16 new listings. Of those, 11 are already under contract. Of the five that are not under contract; two are brand new listings today, one was listed yesterday, one was listed four days ago and the worn listing of the bunch has been listed a whopping eight days! On the chart below A/B under the status column signifies that is under contract but taking backup offers.

After a long cycle where buyers have been in the drivers seat the market has clearly shifted to a sellers market. Let me give you a few examples of seller confidence as seen in the listings above.
875 38th – This home is a nicely maintained and modestly updated home in the starter home neighborhood of Baseline Subdivision. Over the past year the average price per square foot in this neighborhood has been $312. The price per square foot on this listing came to $380. The previous high over the past year on a per square foot price was $362. This home was listed on February 21st and it was marked as under contract by February 25th with what the listing agent says is a “close to full price offer”.
804 Brooklawn – This is basically a vacant lot listing. The house probably won’t be worth saving since it sits on a very large lot. The house across the street is under contract and is listed for just under $1.1 million. This home closed on February 19th for $430,000. It came back on the market four days ago for $550,000.
3255 Emerson – This house is brand new on the market today. They know the market is hot. They have announced in the listing that all offers will be presented Sunday at 4 pm. I wonder how many they will get?
We put a house on the market last week and within four days we had four offers. The property went for well above list price and we have a backup offer.
 What is causing this dramatic sellers market? Buyers are out in force ready to buy and the supply of homes is no where near satisfying the demand. At the end of January there were 1171 properties on the market in all of Boulder County which didn’t have a contract on it. As we progress toward spring you would expect more properties to be available but the opposite is true. As of this morning, exactly four weeks later there are 900 single family residential listings on the market available.
How long this will last will be anyone’s guess, but for the moment we have extreme competition for the best new listings and that competition is causing prices to rise.

by Neil Kearney | Feb 13, 2013 | Boulder County Housing Trends, Statistics
Real estate sales in Boulder County continued the strong trend which began last year. Sales were up 27% in the first month of the year. Helping the sales numbers was a jump in available inventory. As of the end of January the number of homes on the market equaled last year. We will need to continue to add new listings to keep the market strong into the spring.
Interest rates have gone up a bit lately and I’m sure that has something to do with the early activity in the market. Also helping the market this January and February is unseasonably good weather. I noticed my bulbs are starting to sprout in the front yard. Where is winter this year? The attached slideshow shows the activity in the market for the month.

