As we move towards the holidays and winter the Boulder area real estate market is still very strong. Consistent buyer demand has put sellers in a very good position. Multiple offers on well priced properties are common. We are still seeing a wave of out-of-town buyers in various stages coming to town. I expect that this wave to continue into the spring 2021 season. The pandemic is ramping up again which may make showings more difficult in some instances, but it hasn’t seemed to dampen buyer demand.
Statistical Note: In October 2020 IRES MLS the facilitator of cooperation and the keeper of the data for Northern Colorado began sharing data again with REColorado the MLS for the Denver Metro Area. This data surge resulted in a jump in properties that are included in this report. The jump will even out over time but for now it’s difficult to know exactly how much of an effect this has on the data. Overall, the trends are still significant.
As I have detailed in my recent blog posts, the market has rebounded very well during the summer and fall of 2020. Sales have now surpassed last years sales through the same time period and prices are again on the rise. The big issue we are seeing is not demand, it is supply. The inventory is very low and as of this writing, 59% of the active listings in Boulder County are marked as “under contract” or “pending”.
This blog post will specifically highlight the luxury segment of the Boulder County real estate market. Has it bounced back as quickly and as strong as the market in general? Are luxury condos keeping up with single family homes? How is the ultra luxury segment doing? Read and watch on, I’ll try to answer those questions as well as others.
First of all, $1,000,000 used to be an impressive sum for a house in this area. Not so much anymore. In fact, the median price of a single family home sale in Boulder so far this year is $995,000 and the average price is $1,266,000. Spending $1,000,000 doesn’t exactly set you apart these days. However, for this blog post, I’m going to give information on both the $1 – $2 million price range as well as the $2 million and above price range.
City of Boulder – Single Family
$1- $2 Million
55% of the 93 listings in the City of Boulder area under contract.
158 sales so far this year which is a 9% increase.
3.5 months of active inventory if the sales rate over the last six months persists. (According to National Association of Realtors this is a sellers market)
More than $2 Million
32% of the 72 listings in the City of Boulder area under contract.
50 sales so far this year which is a 31% increase.
8.6 months of active inventory if the sales rate over the last six months persists. (According to National Association of Realtors this is a buyers market)
City of Boulder Attached Dwelling
$1- $2 Million
31% of the 36 listings in the City of Boulder area under contract.
14 sales so far this year which is a 33% decrease.
15.4 months of active inventory if the sales rate over the last six months persists. (According to National Association of Realtors this is a buyers market)
More than $2 Million
62% of the 16 listings in the City of Boulder area under contract. (*see note below)
0 sales so far this year. There were three during the first 10+ months last year.
*Note – All 11 active listings that are under contract are new construction condominium projects. The price range on these projects are $2.2 million to $3.5 million. There are a few units available at 3rd and Pearl. Let me know if you have interest.
For Comparison – Boulder County – All Price Ranges
59% of the 93 listings in the City of Boulder area under contract.
3,171 sales so far this year which is a 1% increase.
3.29 months of active inventory if the sales rate over the last six months persists. (According to National Association of Realtors this is a sellers market)
What’s Happening With the Ultra Luxury Market – $4,000,000 and up?
It’s a national trend, the wealthy are on the move! The pandemic has caused many people to question whether their current home is the best place to work from home and stay safe with their family while still enjoying the outdoors. Many with second homes have moved in full-time. Others are leaving their high-end, city properties and heading for lifestyle locations like Boulder. Here are the statistics for properties $4,000,000 and above in Boulder County this year.
There was definitely a summer surge for these types of properties. 10 of the 16 sales closed in August, September or October. The good news is that there are still quite a few properties to consider in this price range.
There are currently 37 active listings. Three of which are under contract.
The current listings, updated continually appear below.
The pandemic has had a surprising effect on many real estate markets throughout the United States. Many areas, including Boulder County, have seen a very strong market over the past few months. Other areas have seen a drop in demand as residents seek more personal space while continuing to work remotely.Our area is definitely seeing migration from other parts of the country.This isn’t a new phenomenon, but it has been accelerated by the events of 2020. The pandemic, the fires in the western U.S. and low interest rates have people on the move. Last year at this same time I was writing about increases in inventory and slowing appreciation. This year, I’m seeing just the opposite.
A quick recap of our local real estate market so far in 2020.
Sales activity started out very brisk. YTD sales in the county were up 23% through February. A strong start!
In the first weeks of March, the real estate market was ‘shut down’ along with everything else and closings in April and May were down 30% and 48% respectively.
We began to slowly start to show properties again in May and closings in June were about equal to where they were the previous year.
Since June 1st we have seen a very strong market with monthly sales up 21% in July, 25% in August and 21% in September.Total sales are now back up by 2% for the year.
After slowing and even slightly negative appreciation at the end of 2019 and the beginning of 2020, prices are now on the rise again.
A few of the factors that are causing this resurgence in home sale activity are as follows.
Low interest rates are keeping payments affordable. Currently rates are in the high 2’s and low 3%’s for the most qualified borrowers.
Homeschooling and working remotely are causing people to rethink their space needs. Never before have people spent more time looking at their own four walls! Many have used this time to reevaluate and then act boldly as they reimagine their future.
A few years ago I saw many reports that the millennial generation wasn’t interested in buying real estate. The reports said that they were more interested in experiences than owning something. Well, that prediction has not come to pass. We are seeing many first time homebuyers in this market including millennials.
The economic recovery has not been an equal for all. On average, renters and lower wage earners have been more severely affected by the shut-down. Those with higher wage jobs have not been affected (actually the savings rate has gone up) and are in a good position to take advantage of the buying conditions.
This report shows positive signs in all aspects of the home sale market in Boulder County.I expect this trend to continue,but there is still much uncertainty ahead.Homes continue of sell and as always, I’m actively helping buyers and sellers successfully close transactions.I’m always here for you to be of service.Enjoy the report below and stay in touch! For best viewing, click on the full screen icon in the top right hand corner or download the report here.
The local real estate market continues its strong run! Since June buyers have been very active and despite taking a nearly two-month hiatus in March and April, total sales have now exceeded 2019 through the first three quarters. The market can be characterized by low inventory and high demand. The average sale last month closed for 99.62% of the listing price. On average, those listings received an offer after being on the market for 30 days. View the slideshow below for more details including five year trending.
Just like a warm October afternoon, the Boulder Colorado real estate market is still hot! Inventory is at the lowest levels that I have seen in my 30 years in the market but despite that, activity remains strong. Boulder is a destination city and we are gaining residents coming from other parts of the country. The pandemic, the rise in telecommuting and the fires have pushed many buyers to look at the Boulder market.
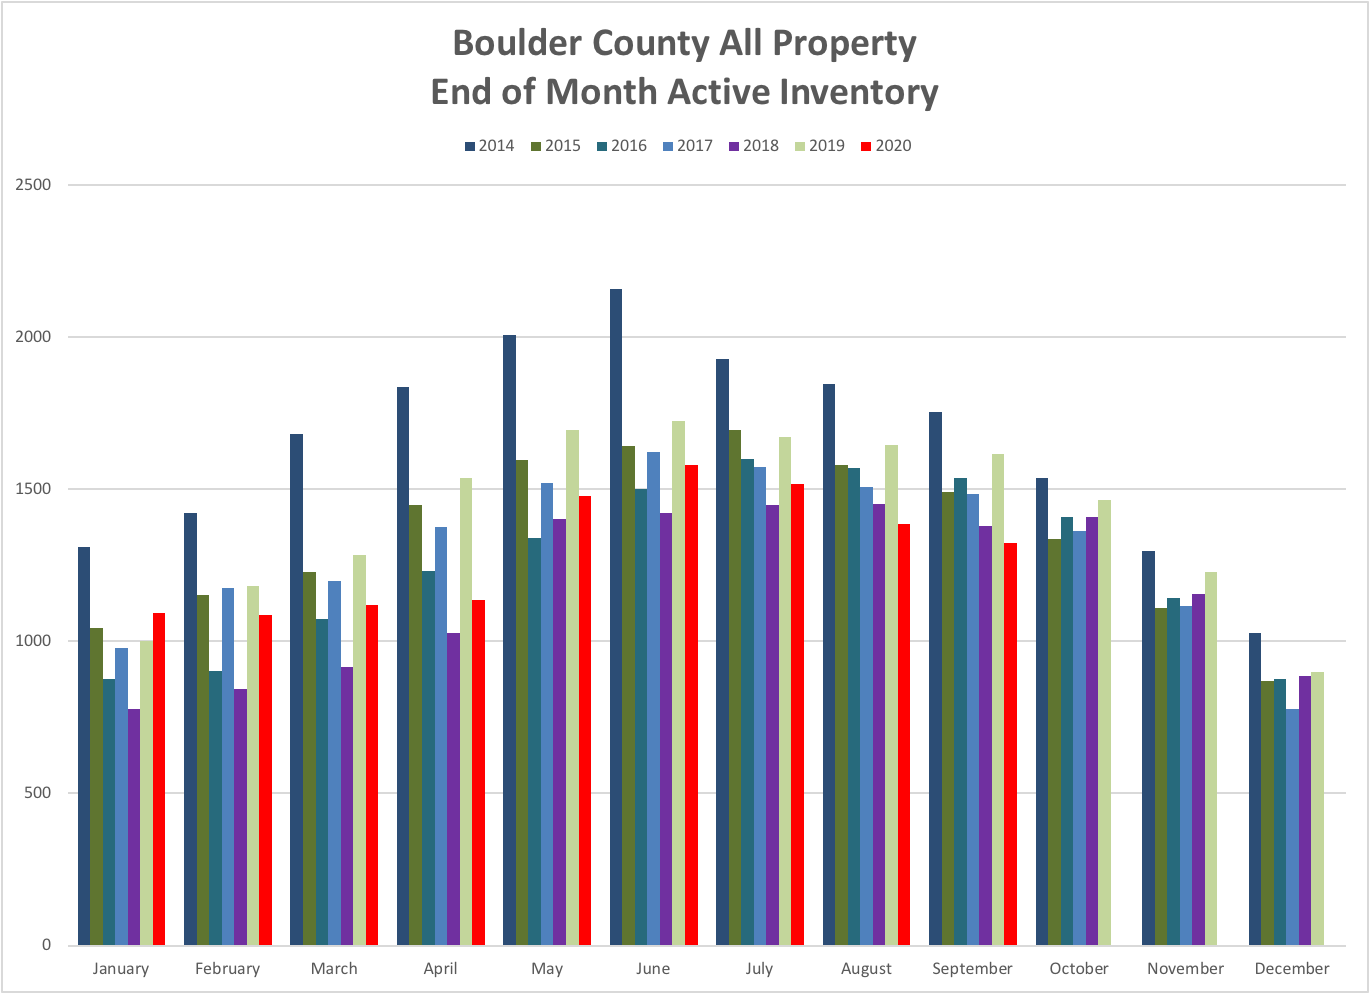
This chart shows the end pf month inventory in Boulder County and includes both single family homes and attached dwellings. For the end of September we are at the lowest level of a low inventory time.
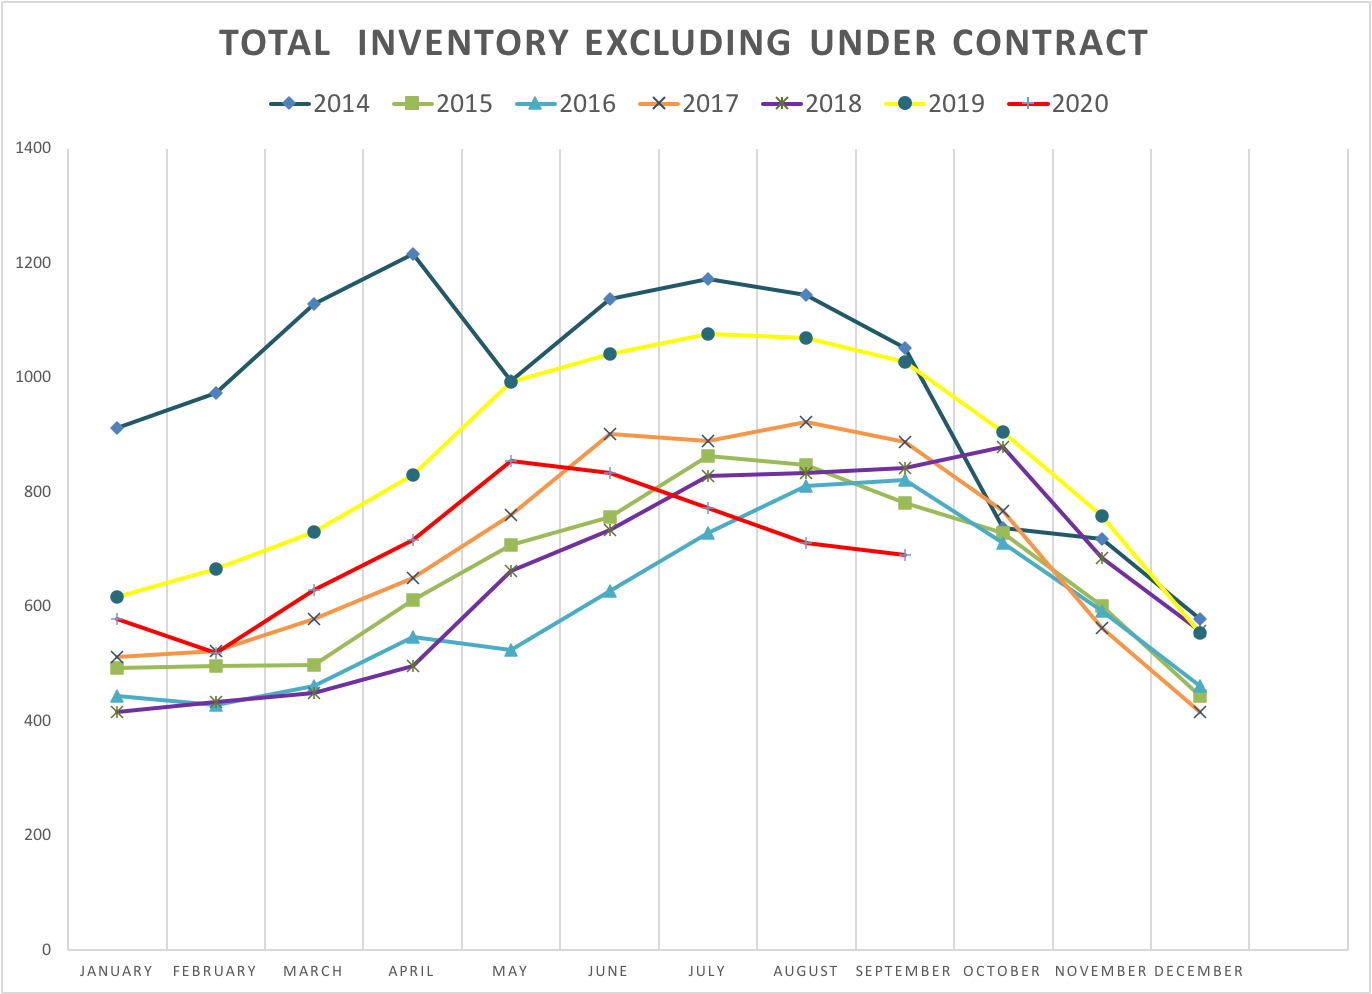
This chart shows the inventory of properties without those that are already under contract. That reduces the number by about 50%, but the overall trend is about the same.
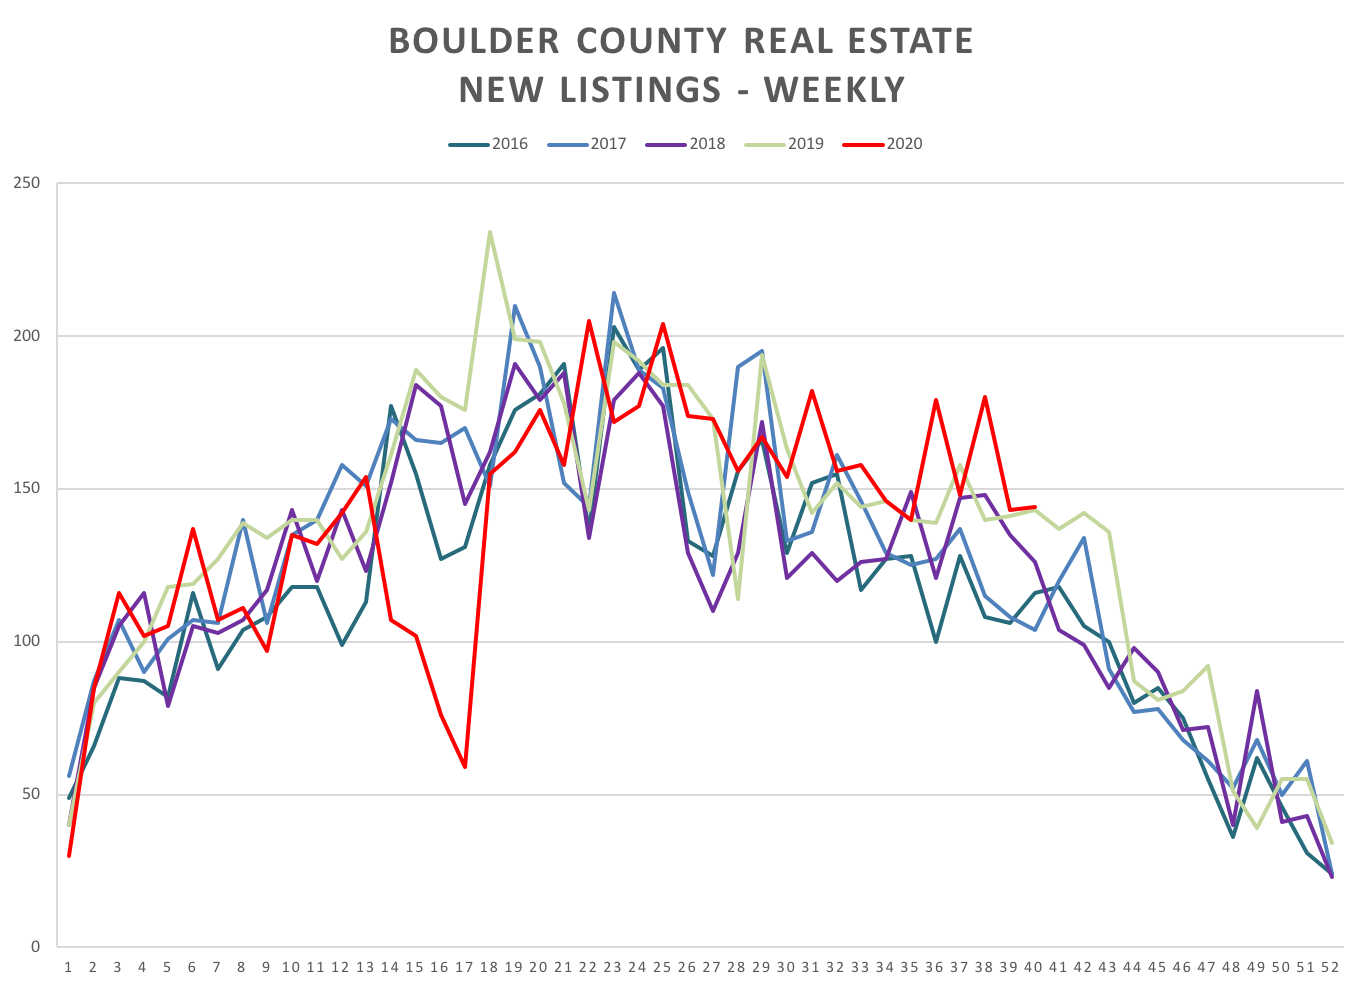
New listings, especially recently have remained above the average for this time of year. Despite the new supply, it’s not keeping up with demand.
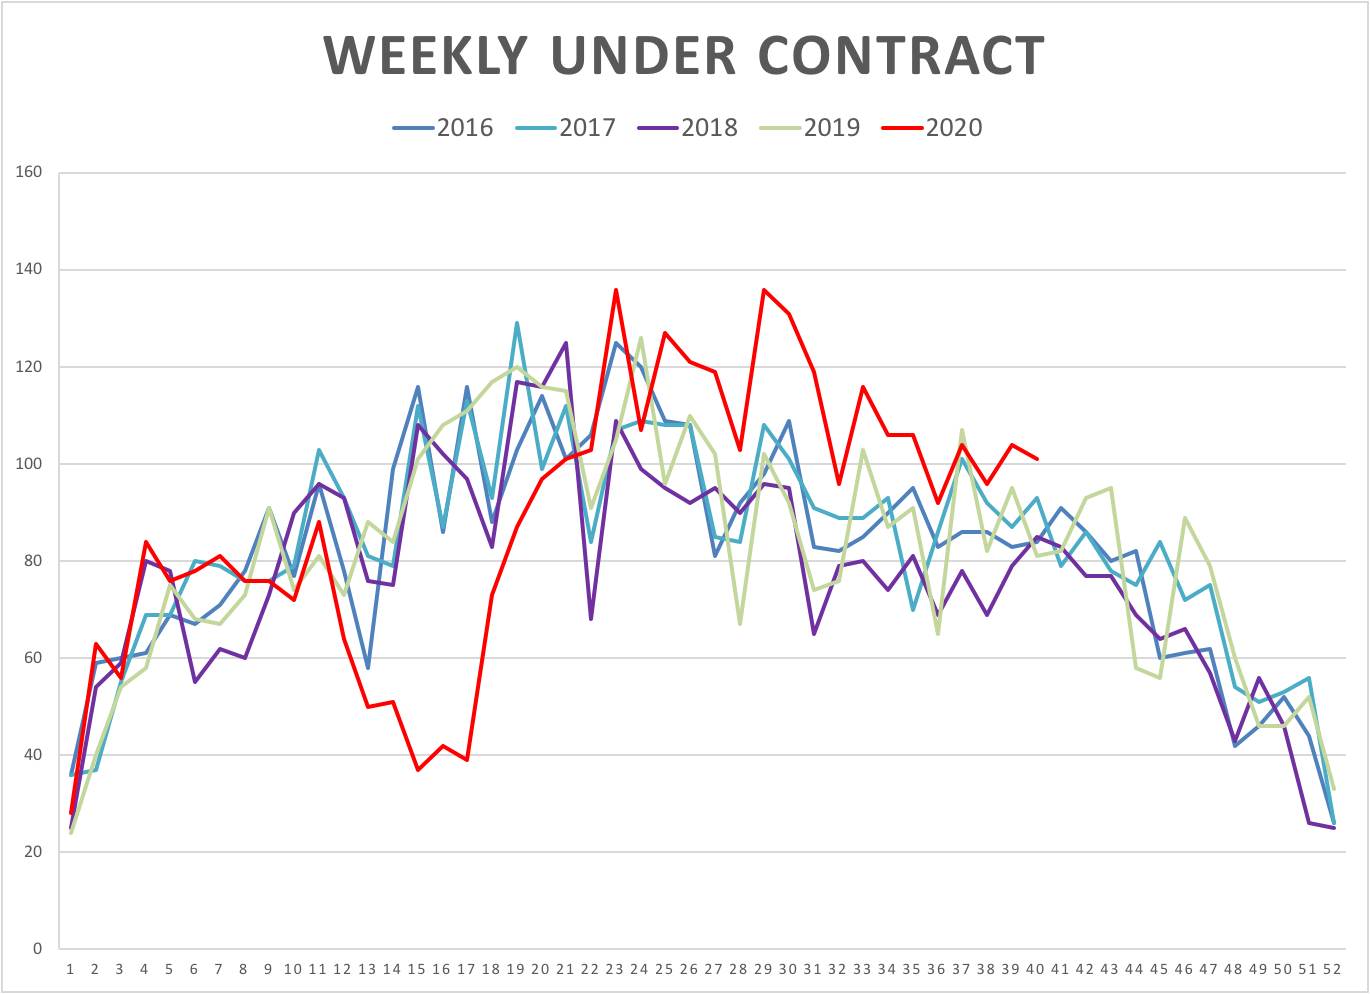
This chart shows the number of homes that have gone under contract on a weekly basis over the last 5+ years. Since June 1st we are exceeding all other recent years. Sales have followed and I expect that this month we will exceed the pace of last year despite a two month respite.
The local real estate market continues to be very active and strong. More properties are selling than are coming on the market resulting in a loss of inventory. When inventory of available homes is very low it results in shorter days on the market and increased prices. After seeing stagnant prices earlier in the year it appears that prices are on the rise again. Sales in August were up 25% compared to the same month a year ago. With the strong summer year-to-date sales in Boulder County are now down just 1% from a year ago. With the current momentum, I expect that even with a two-month hiatus, sales in 2020 will exceed 2019. See the slideshow below for full details and five year trends.