Overview
After some uncertainty in March, April and May, 2020 turned out to be another strong year for the Boulder area real estate market. A year ago, I wrote how we were moving toward a more balanced real estate market, with higher levels of inventory and slower price appreciation, but just like everything else, the pandemic turned this trend around. We are now seeing a continuation of the long term trend of high demand and low inventory. The outcome of this disparity is multiple offers, time pressure on buyers and rising prices. On average for the year it took 34 days for a property to go under contract. This is similar to recent years, but in practice I’ve found that desirable properties are finding a buyer much faster.
The market pressures we are seeing locally are being echoed throughout the country. For the first time, all 50 states saw a positive price trend in the third quarter. The only exceptions to the “hot” market are large cities which are seeing residents opt for suburban settings if they can afford it. Telecommuting has certainly enabled this trend.
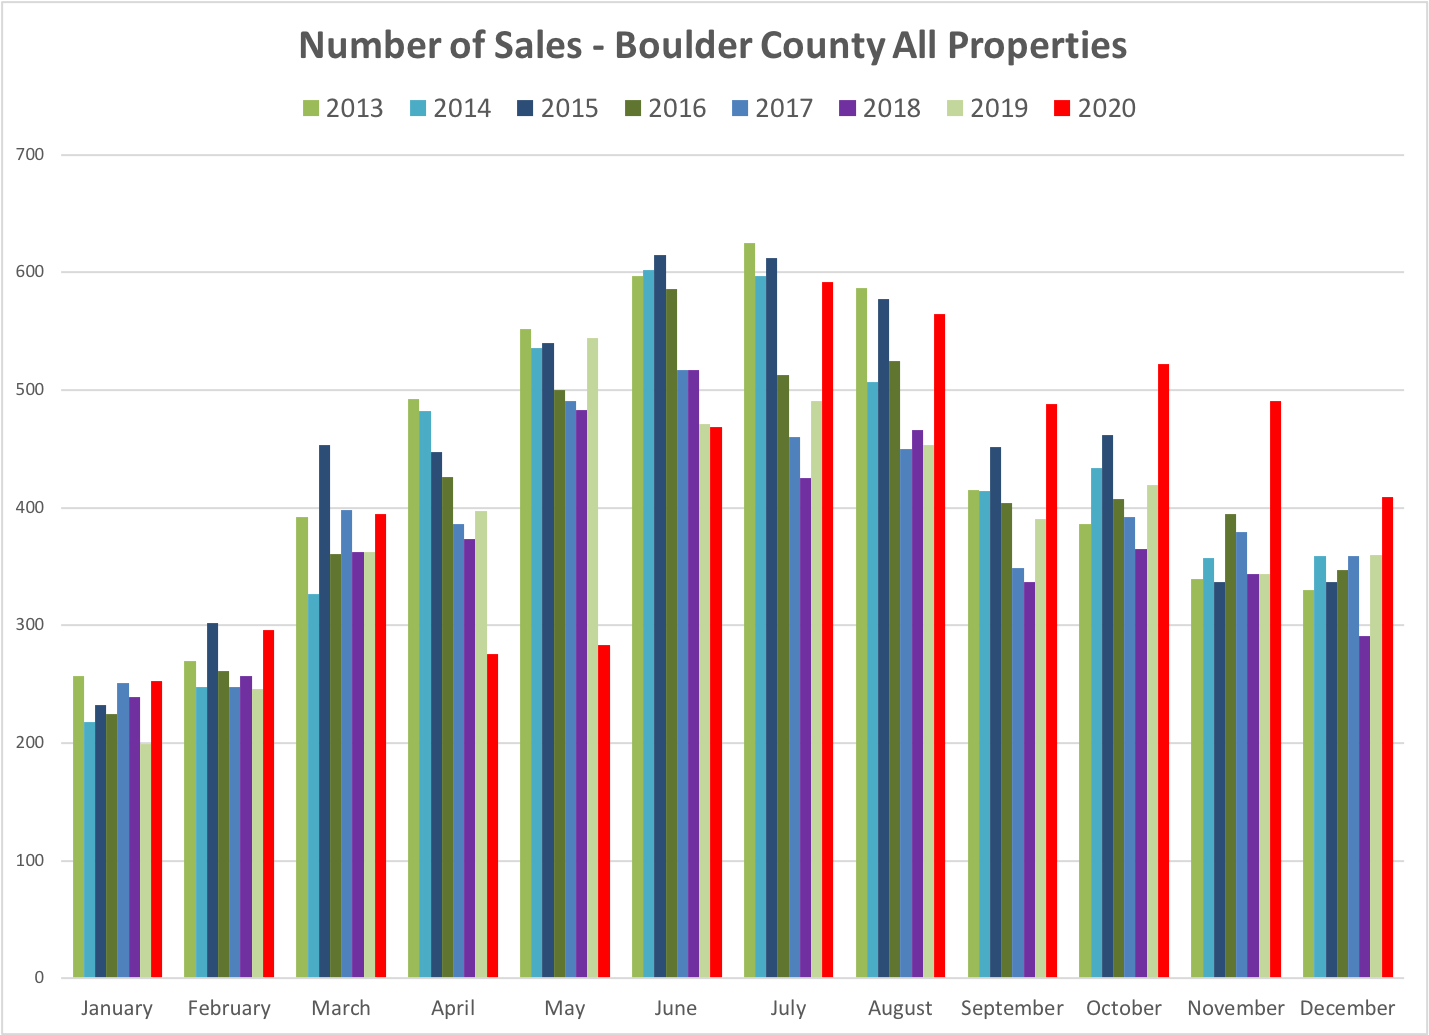
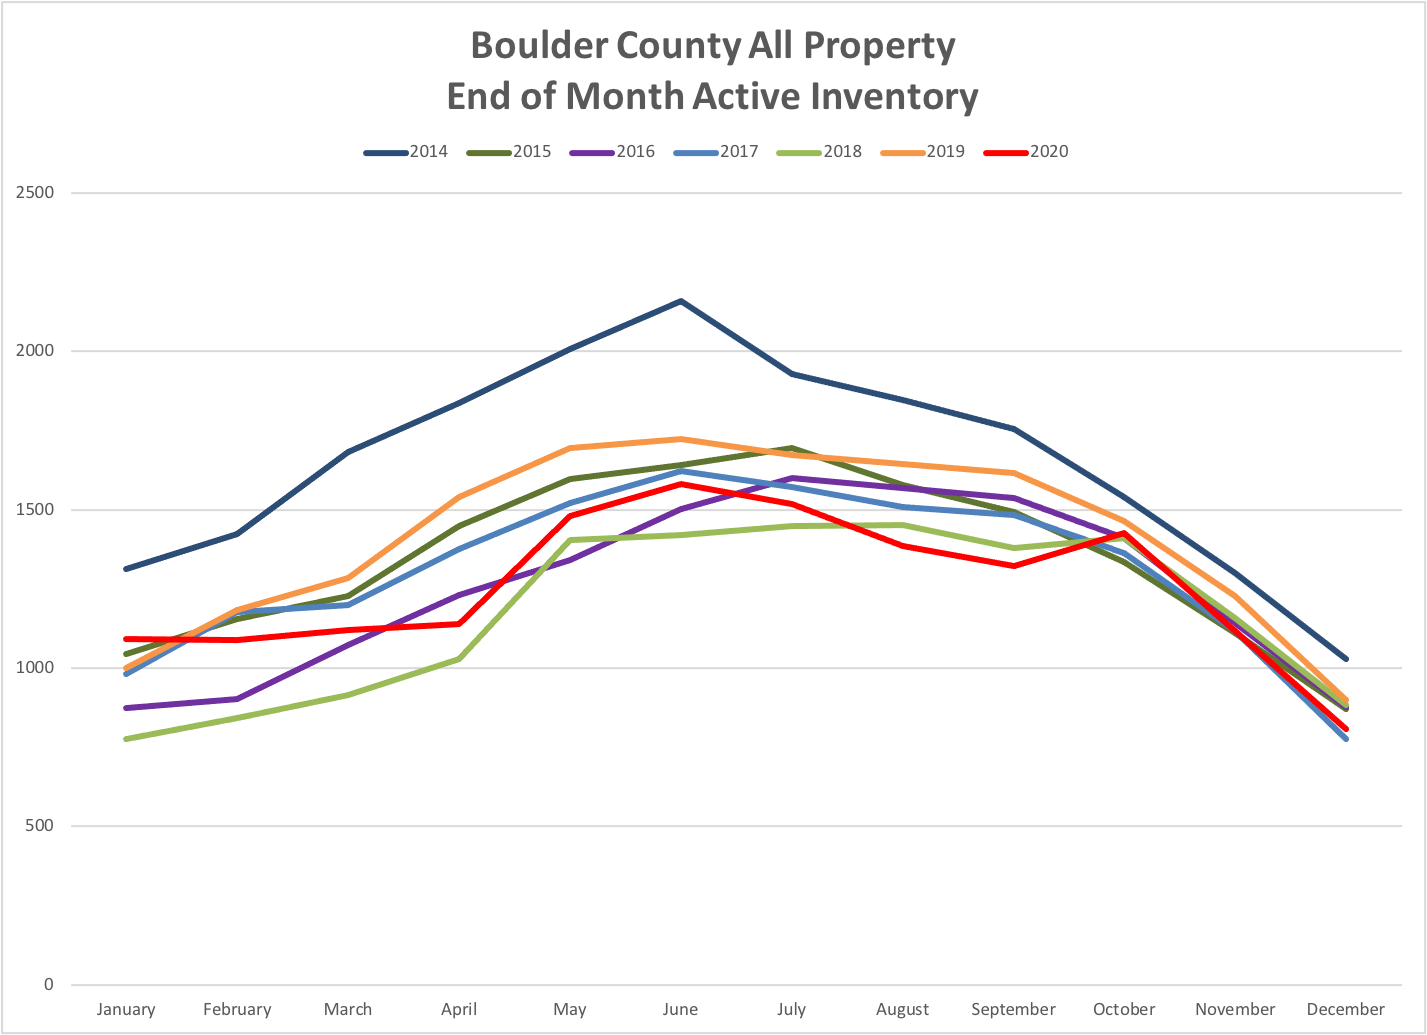
Boulder County has traditionally seen a consistent sales seasonality where sales ramp up from December and January lows and peak in June or July. In 2020, with the stay-at-home orders, our usually smooth sales trend that resembles a bell curve, shifted to the right. This year, the curve has a big dip in the spring and much higher sales toward the end of the year. See the graph directly below.

Here are some of the key statistics for Boulder County real estate in 2020:
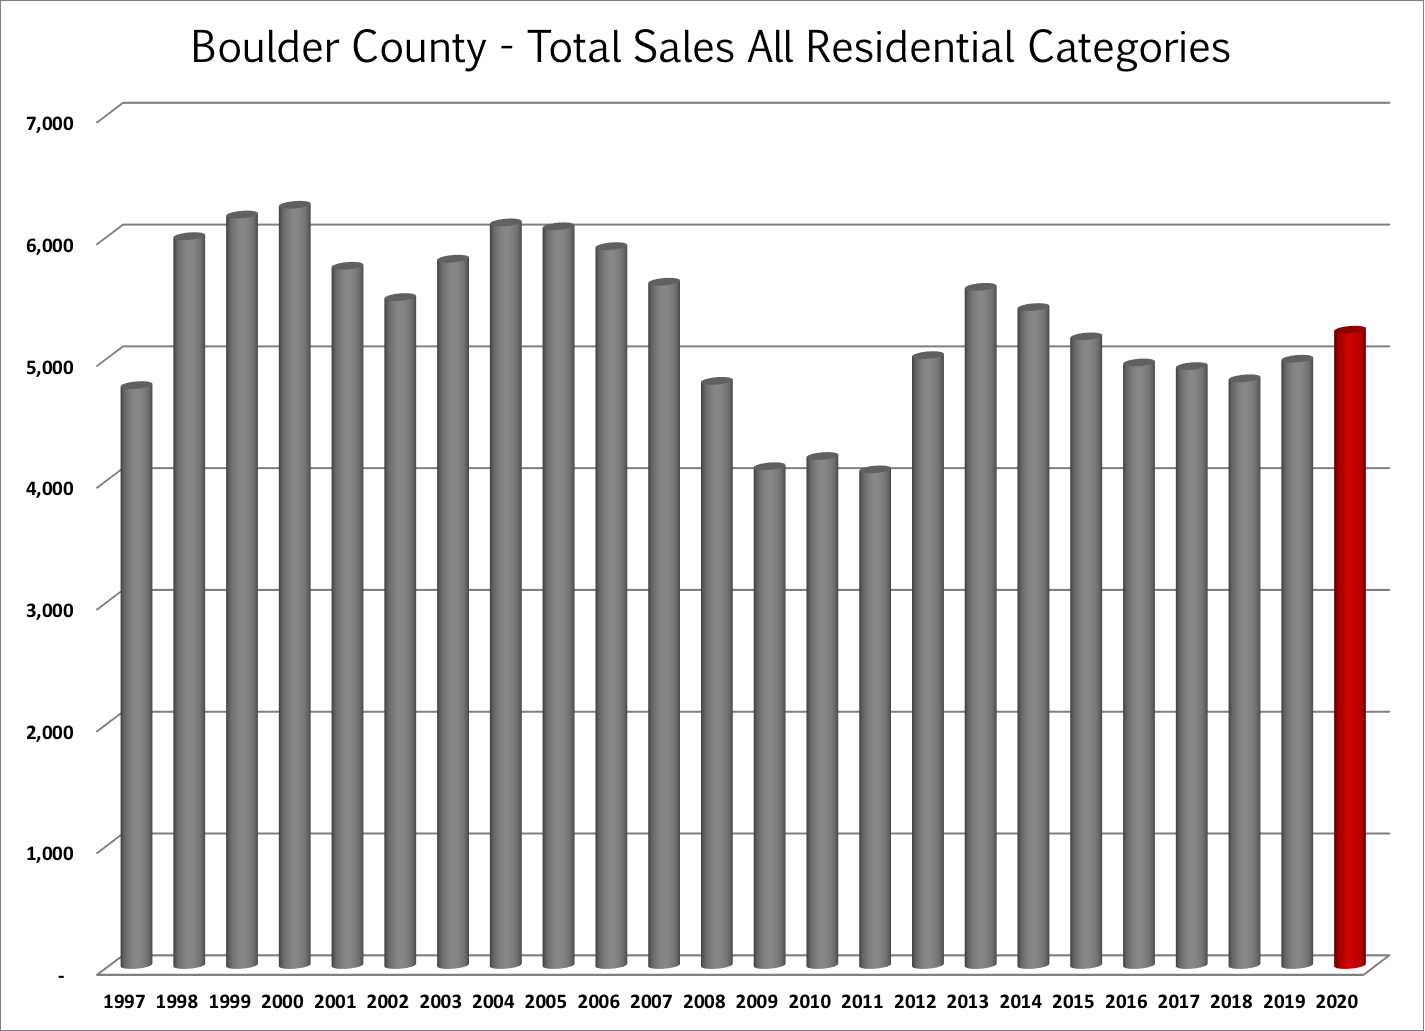
- Total sales were up 5% during 2020 to 5,217 sales. Down 6% from the post recession high in 2013. (See first large graph below)
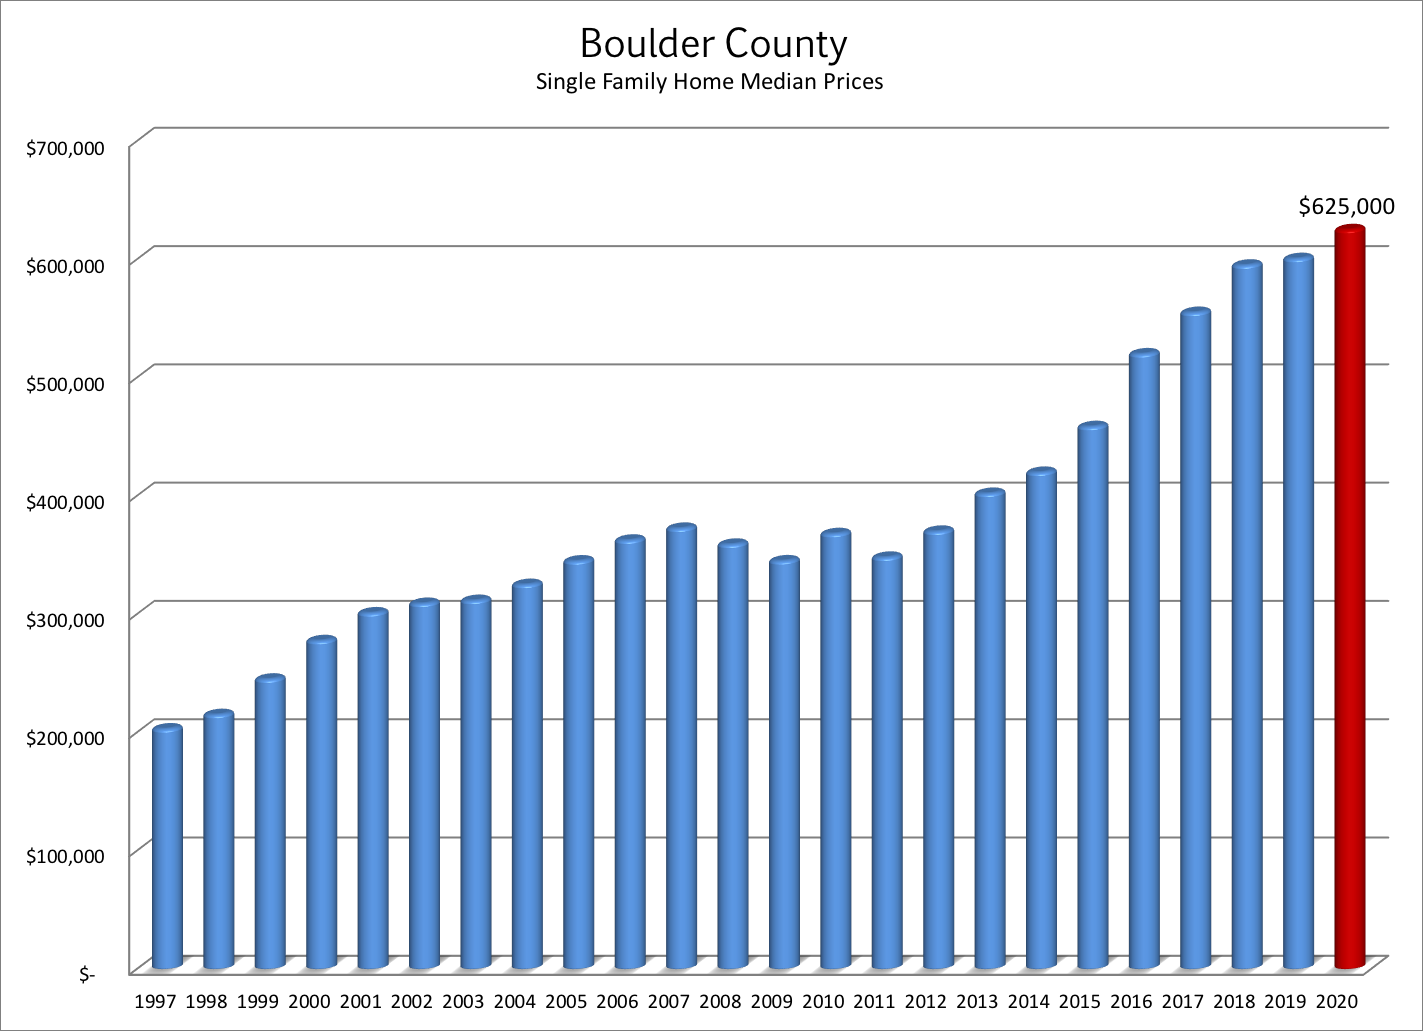
- The median price for all Boulder County single family home sales in 2020 was $625,000 which is up 4% from 2019. (See second large graph below)
- There were 764 sales that exceeded $1 million during the year which is 144 more than a year ago. Not surprisingly, an all time record! See the graph on this page to see the steady climb of + $1 million sales. There are two factors at work here. First is the cumulative price appreciation. Second is the improvement in the housing stock. There are many new homes and many significantly remodeled homes which make comparing the present sales to those a decade ago similar to comparing oranges to tangerines.
- At the end of December there were just 807 properties on the market in Boulder County and 438 (55%) of those were already under contract. This is 10% less than we had a year ago and near an all-time low. Inventory not meeting demand is one of the main themes of the market.
- Average days to offer – 34 (We have been in the 29 to 39 day range for six straight years)
- Average negotiation off of list price 1.2% (1.65% in 2019)
- 29% of properties sold for a price above the list price. The average premium paid for these sales was 2.8%
- 47% of properties sold for a price below list price. The average discount on these sales was 3.1%.
Over the past decade owning real estate in Boulder County has been a great investment! Cumulative appreciation since 2008 has exceeded 75%.
What Is Causing The Surge In Demand For Real Estate?
Affordability
How can it be that even as prices increase buying real estate can be affordable? I see four factors: low interest rates, increasing wages, increasing rents and a surging stock market. Before touching briefly on each of these factors I’d like to acknowledge that the quick economic recovery and surge coincident with the pandemic has not been equally enjoyed across demographics. It seems that those who were well off before became more so and many of those who were struggling before the pandemic find themselves in even a tougher spot financially.
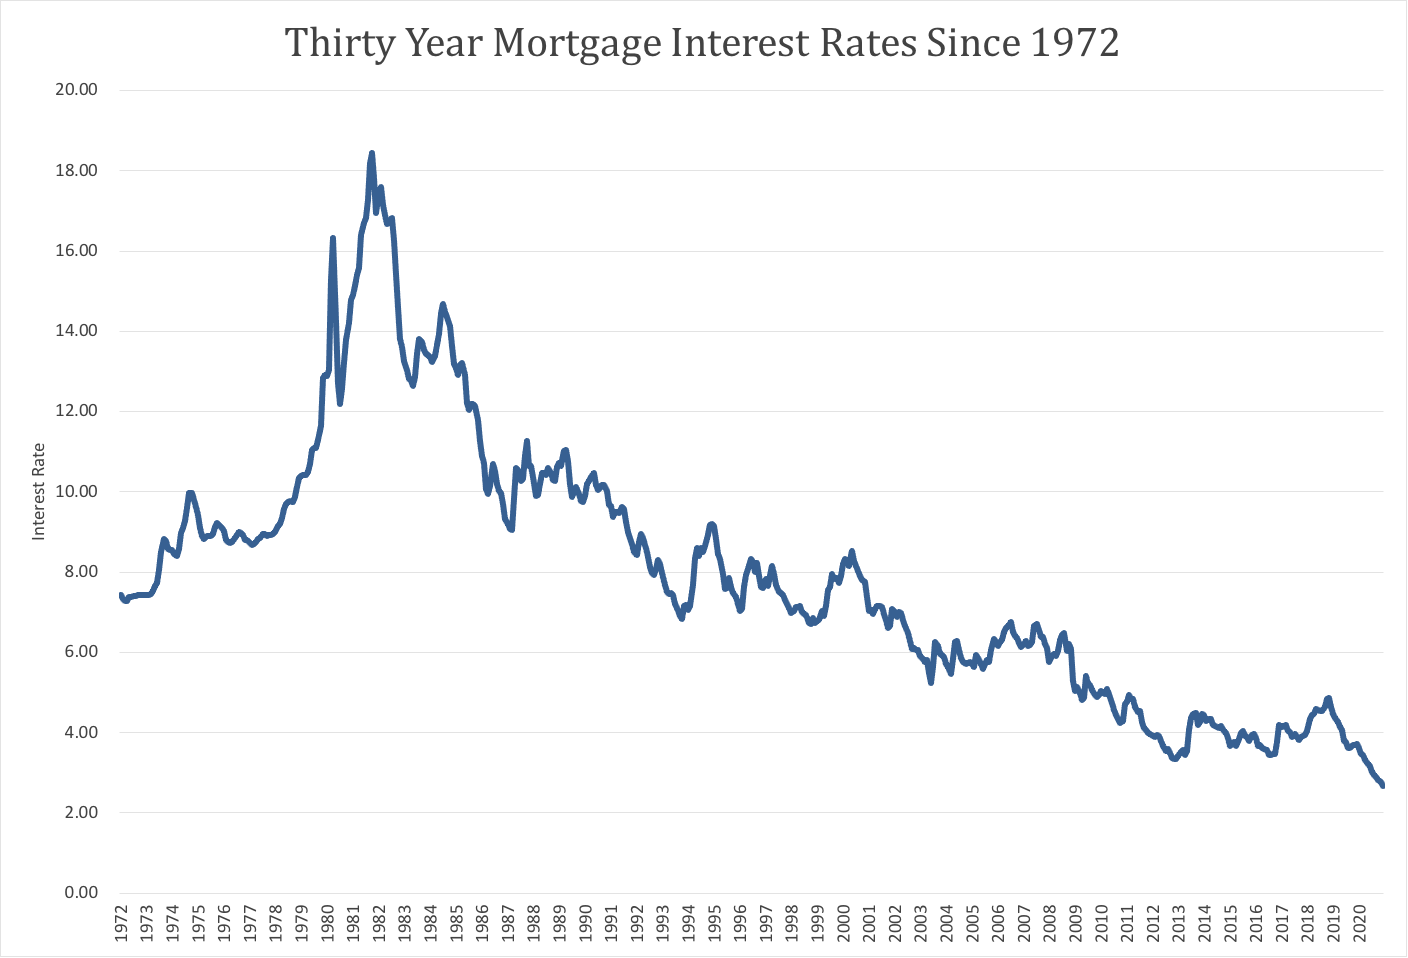
Interest rates have been the saving grace for real estate buyers since 2012. It has been widely predicted over the past five years that interest rates were to rise over the next “X” number of months. But in fact, interest rates have continued to match and exceed all-time lows. This past year, 30 year mortgages were in the in the 2’s and 3’s. These low rates have made home buying (especially as rents have increased) relatively affordable. The graph below shows the 30 year mortgage on a monthly basis since 1972. It’s a great time to lock in a long term rate!
Wages and salaries increased roughly 3% during 2020. Home affordability is usually based upon the metric of how much of a persons income is used for housing. When incomes increase it makes a housing payment more affordable. Over the last 9 months households are saving more money (less spending) as well. A large downpayment increases affordability as well.
Rising rents spur current renters to look into buying. With the thought of locking in low interest rates and having their own place, Millennials (22-39 year olds) made up the largest group of home buyers this past year. 38% of all sales in the United States were from buyers in this age range. Most were first time homebuyers who went from renters to owners.
Wealth Gains – Despite a large drop in value in March, the stock market ended the year with double digit increases for 2020. As I mentioned earlier, the recovery in 2020 hasn’t reached all citizens. Roughly 55% of people in the U.S. own stocks. I’m guessing that a vast majority of stock owners are also already homeowners (67% in the U.S.) and the increases in both asset classes gave the already wealthy a big boost this past year. When the stock market is gaining, people with the means feel emboldened to buy a larger home or to buy a second home. We have seen both of these trends this year in Boulder County. We are seeing a huge influx of people coming to Boulder to telecommute or to retire. Those who are choosing Boulder for the lifestyle have cash to spend.
Supply and Demand – What to look for…
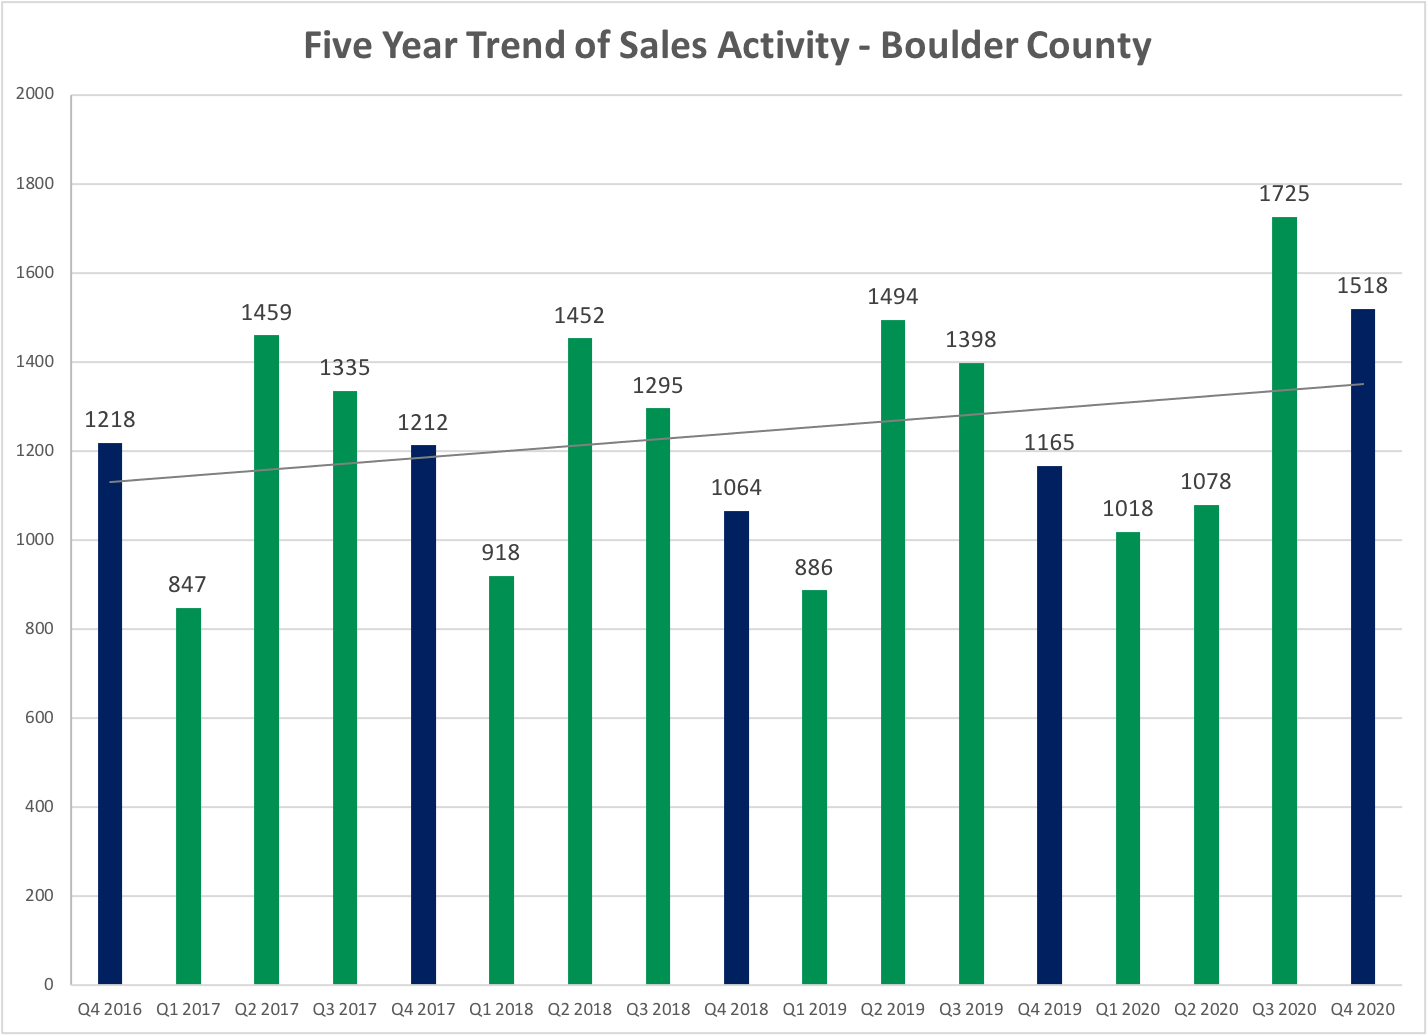
When looking at the local real estate market, supply comes from two sources – people who list their homes for sale and new construction. Since the economic crisis in the late 2000’s, the flow of homes to the resale market has decreased consistently. I have monthly data going back to 2014 and the number of homes on the market at the end of 2020 is over 21% lower than it was in 2014. (see graph below) Historical inventory, prior to 2008, is quite a bit higher than anything we have seen since 2008. To exasperate this even further, with the strong market, at any given time this past year 40% – 55% of the active listings are already under contract. When supply at such low levels, buyers face more competition from other homebuyers and prices tend to increase. In order for the market to shift from a seller’s market to a buyer’s market inventory will need to rise and we haven’t yet seen that happen.
The demand for homes is based upon new people moving to the area as well as the formation of new households (see the discussion of Millenials above). People are moving here for the lifestyle and the jobs. According to the 2021 Colorado Business Economic Outlook produced by the University of Colorado Leeds School of Business, Colorado will see approximately 53,000 new residents in 2021.
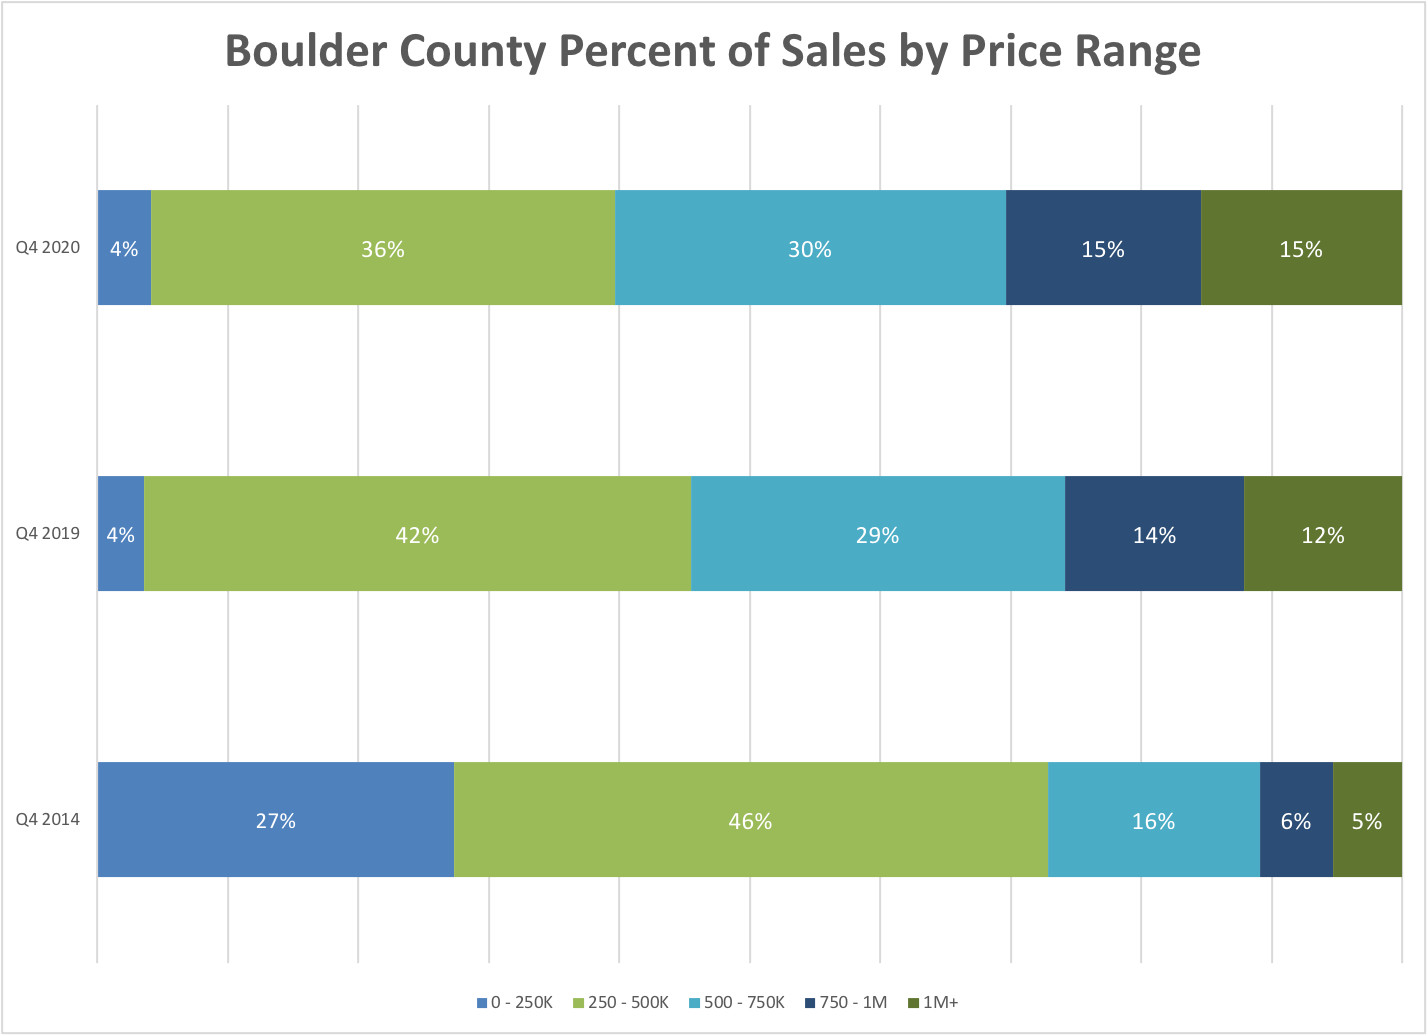
Absorption rate is a statistic that gives an indication as to the balance between supply and demand. Simply put, it measures how long it would take to sell all of the listings in a given area if the sales flow would remain constant and no new listings would come on the market. A balanced market is around 5 – 6 months. Anything shorter is a seller’s market and anything longer is a buyer’s market. As I write this in mid January absorption rate inventory in Boulder County was 1.5 months, a very strong seller’s market. It’s interesting to see how this inventory statistic increases across the price ranges.
- Up to $500,000 – 1.2 months
- $500,000 – $1 million – 1.9 months
- $1 million to $2 million – 2.2 months
- Above $2 million – 6.6 months (balanced market)
New contruction doesn’t seem to be keeping up with demand. Many local new home communities don’t have any availability unless a buyer is looking 6-12 months in advance.
Looking Ahead
Continuing the 2020 trend, 2021 is off to a strong start. It’s definitely a strong seller market for most locations and price ranges. Buyers are again figuring out ways to be competitive in multiple offer situations. I expect that this will continue for a number of months at least. I will be watching closely the number of new listings coming on the market as the supply of homes will dictate the market this year.
Year End Graphs
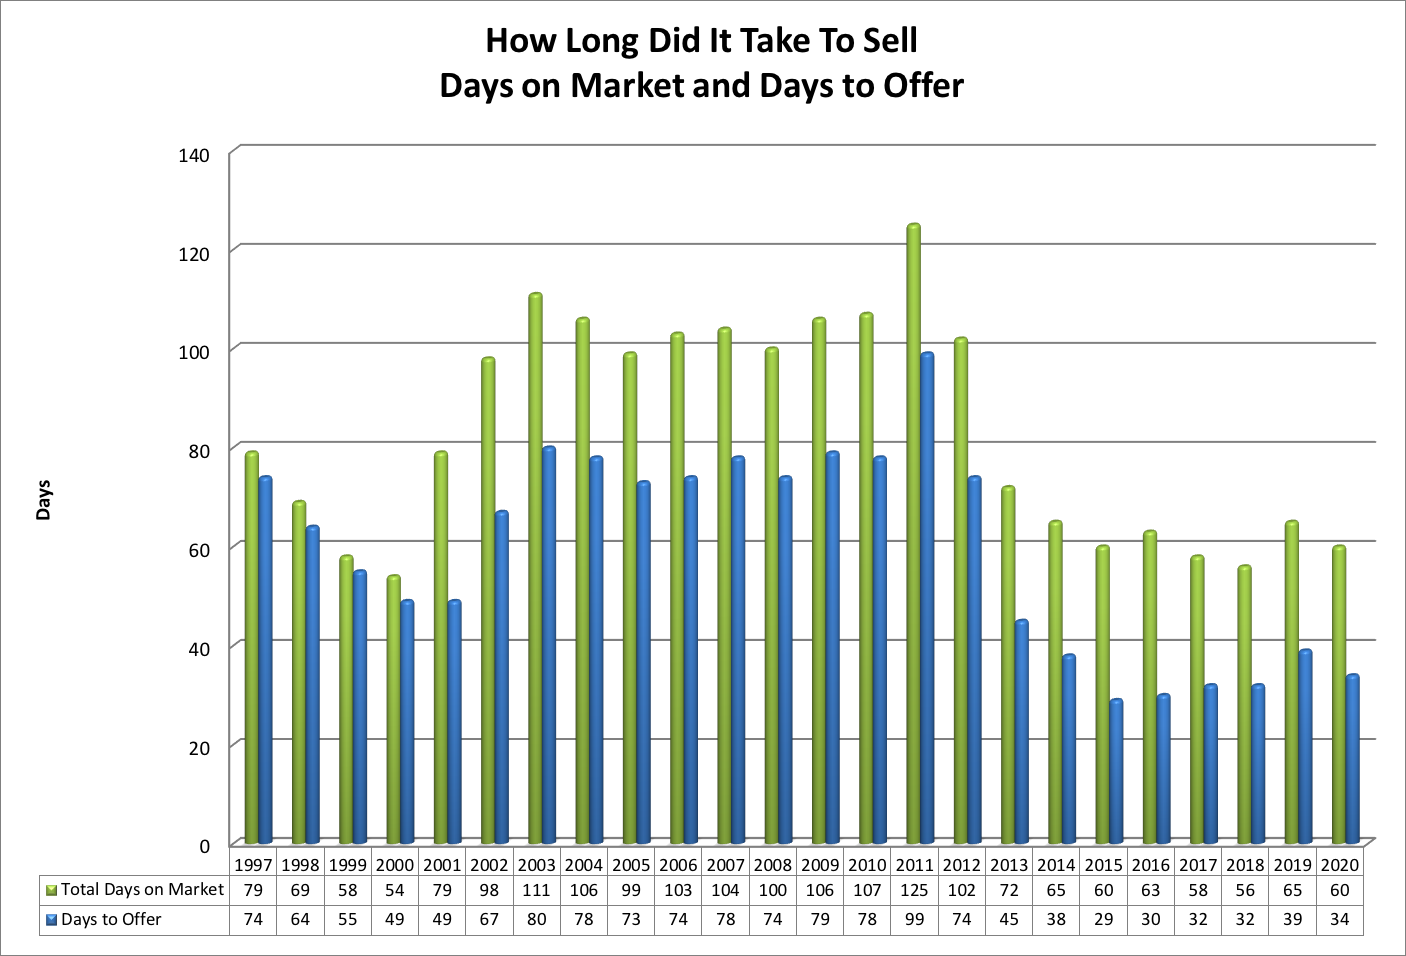 Days on Market (DOM) gives the total time from listing to sale. Days to Offer (DTO) gives the number of days it took for an average seller to accept an offer.
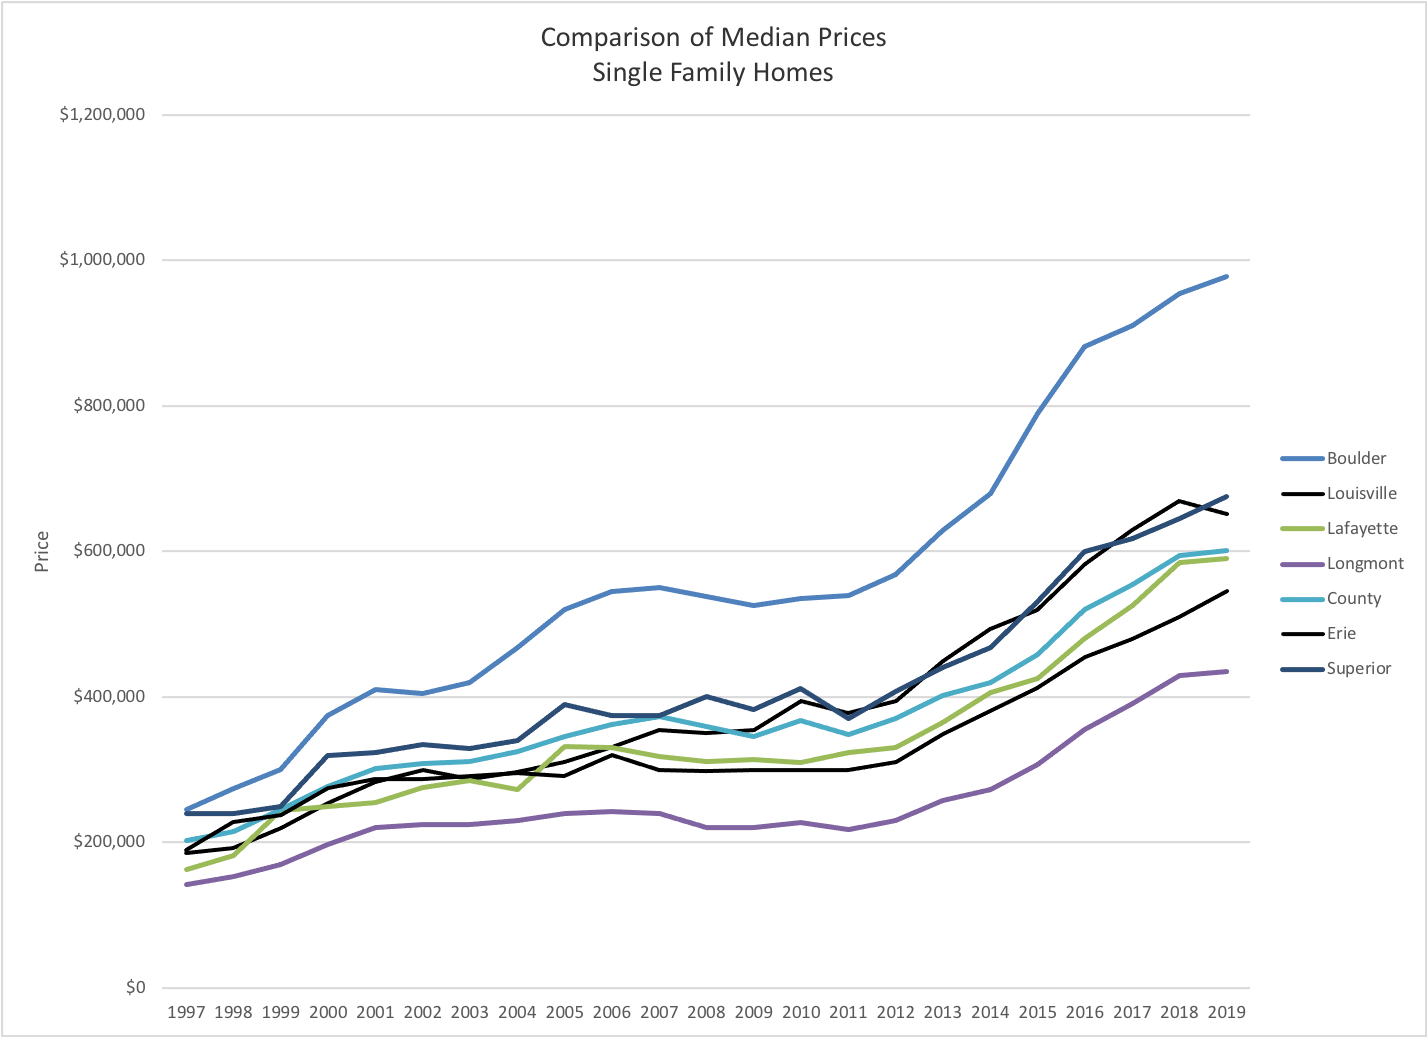 This graph compares single family median prices in the communities of Boulder County.
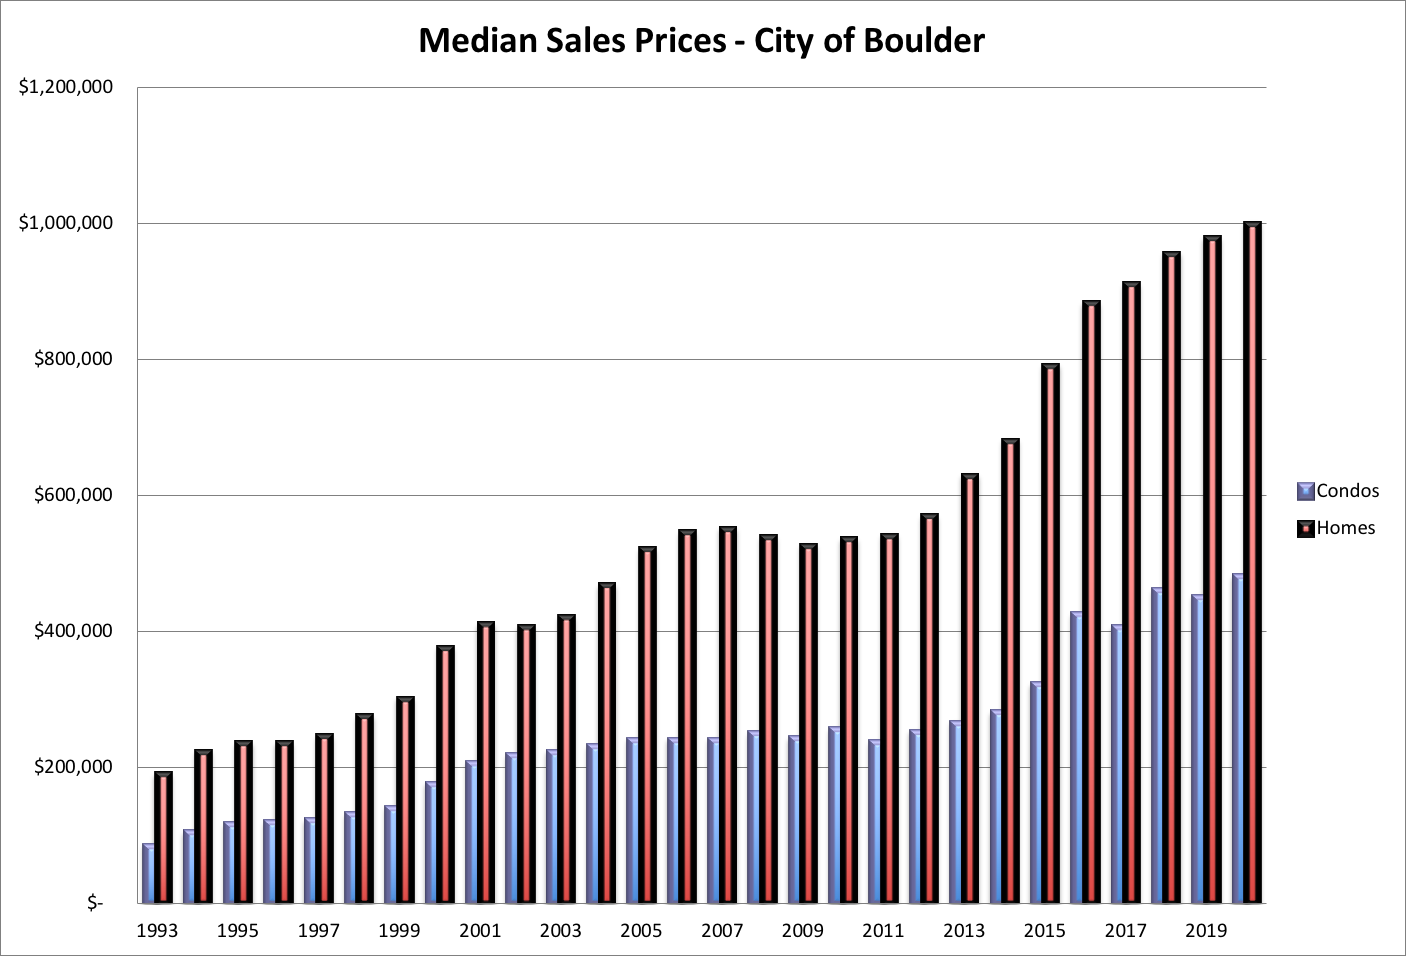 This graph shows the median prices in the City of Boulder, both single family and attached dwellings over time.
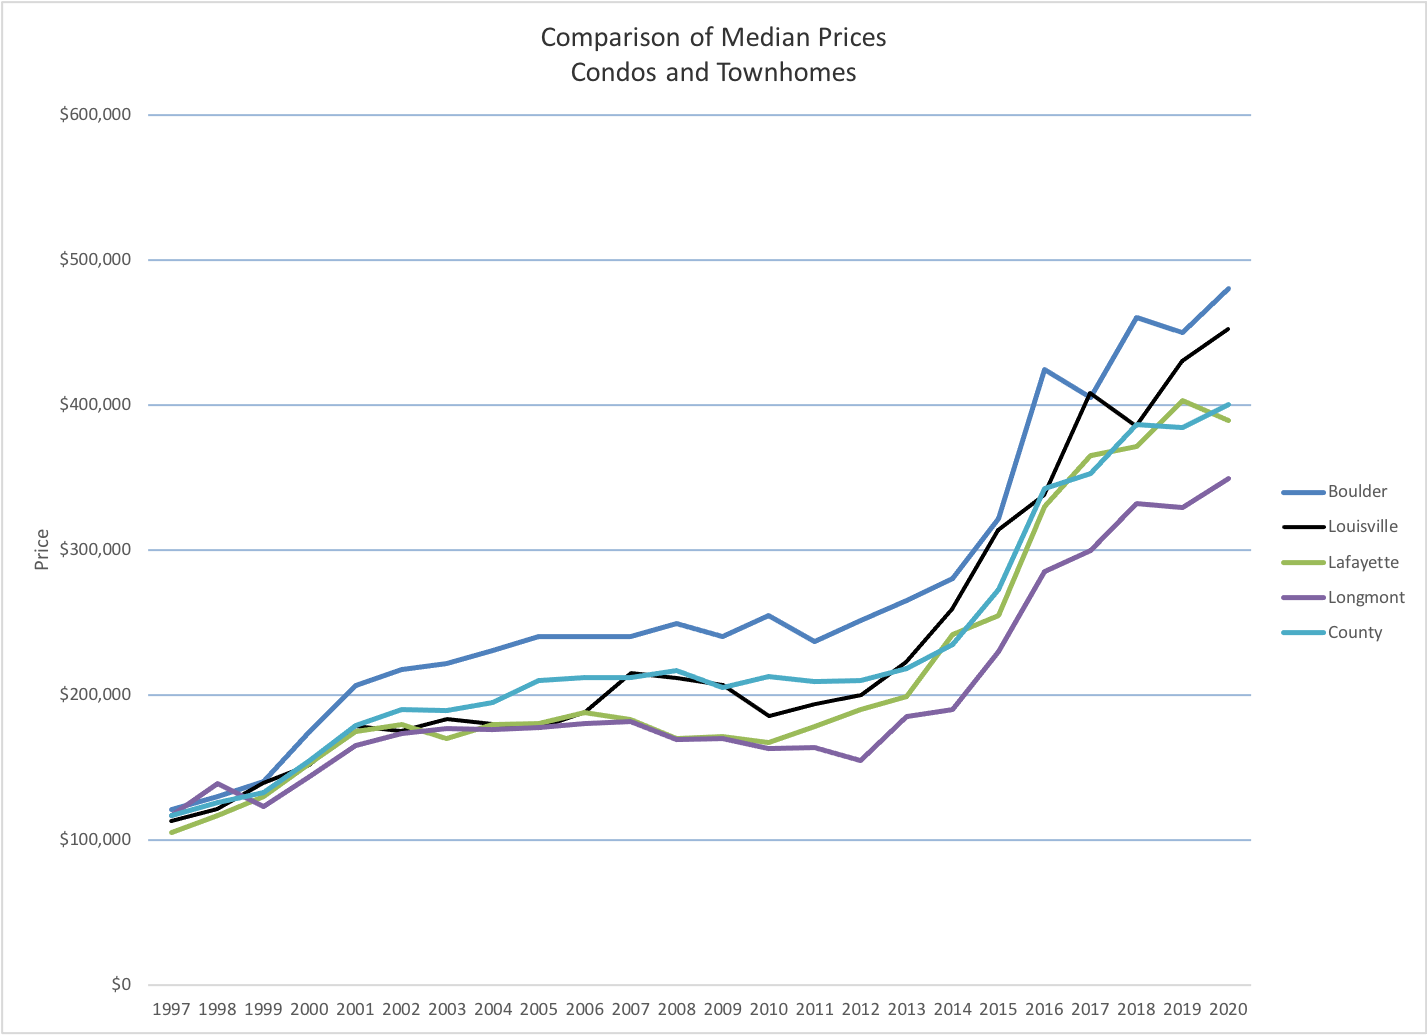 The graph just above shows the median prices of attached dwellings in the different communities of Boulder County over time.
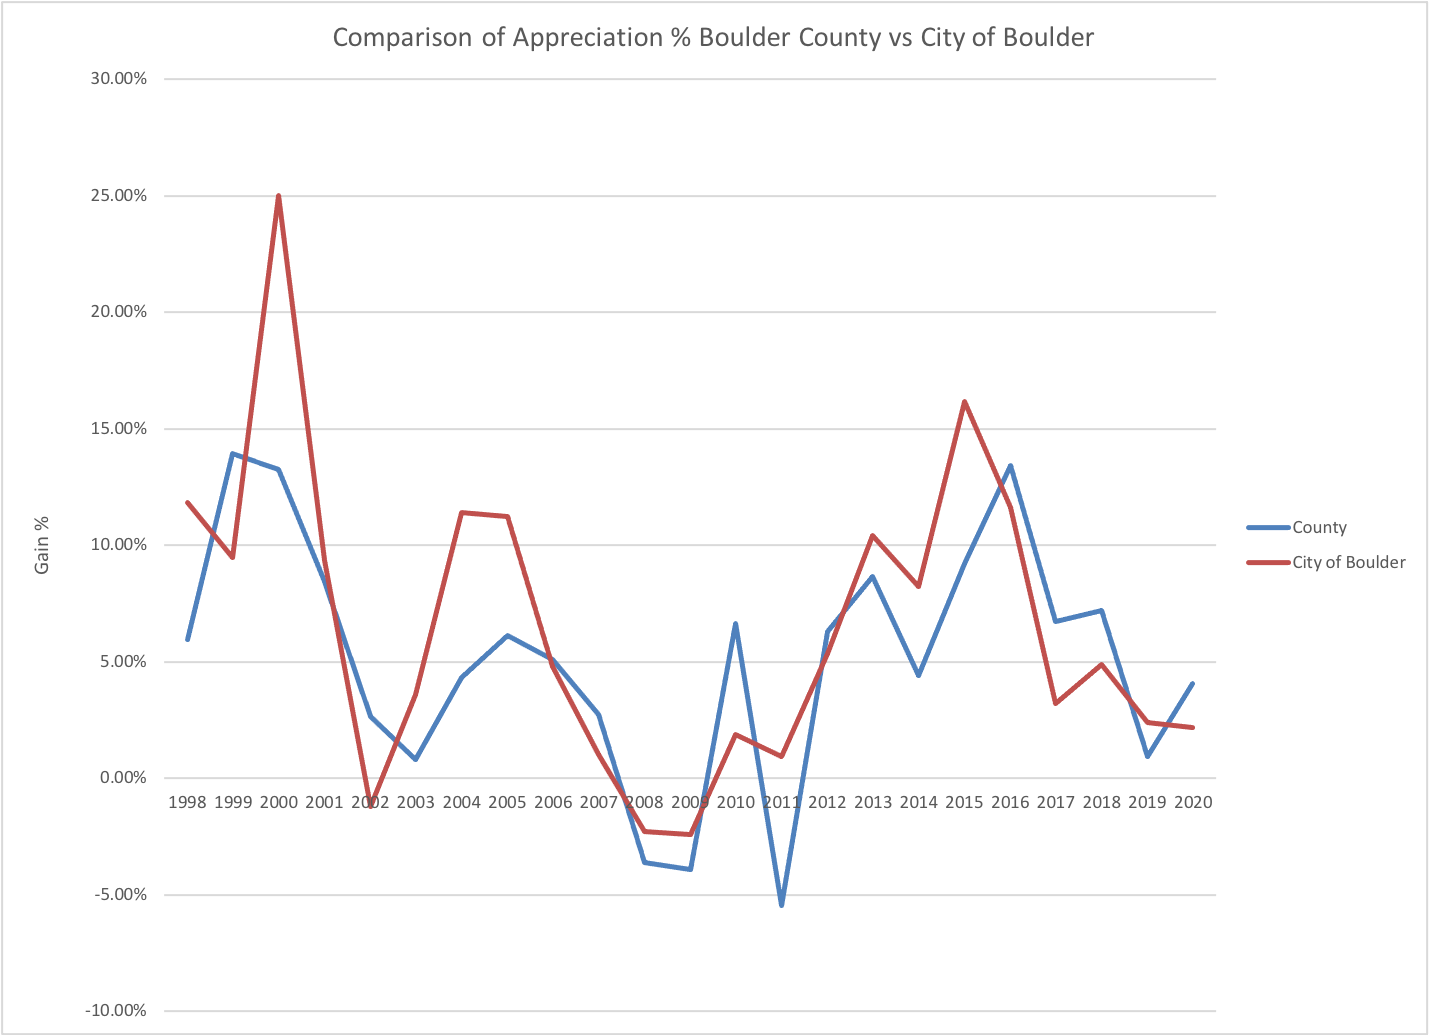
The graph above shows the yearly appreciation % for both Boulder County and the City of Boulder over time.