
Fourth Quarter Boulder County Real Estate Market Report
 The fourth quarter of 2020 was very strong! The last three months were a continuation of a pandemic trend that started started in June just as the strictest stay-at-home orders were lifted. It turns out that staying at home caused people to want to be somewhere else! I personally saw people make decisions to downsize, to buy a bigger house, to re-locate to a dream area and some to move in order to solve the financial stress of the pandemic. After all was said and done Boulder County sales of residential real estate were up 30% from the 4th quarter last year. Even after the loss of the spring season, 2020 ended up with 7.8% more sales than 2019.
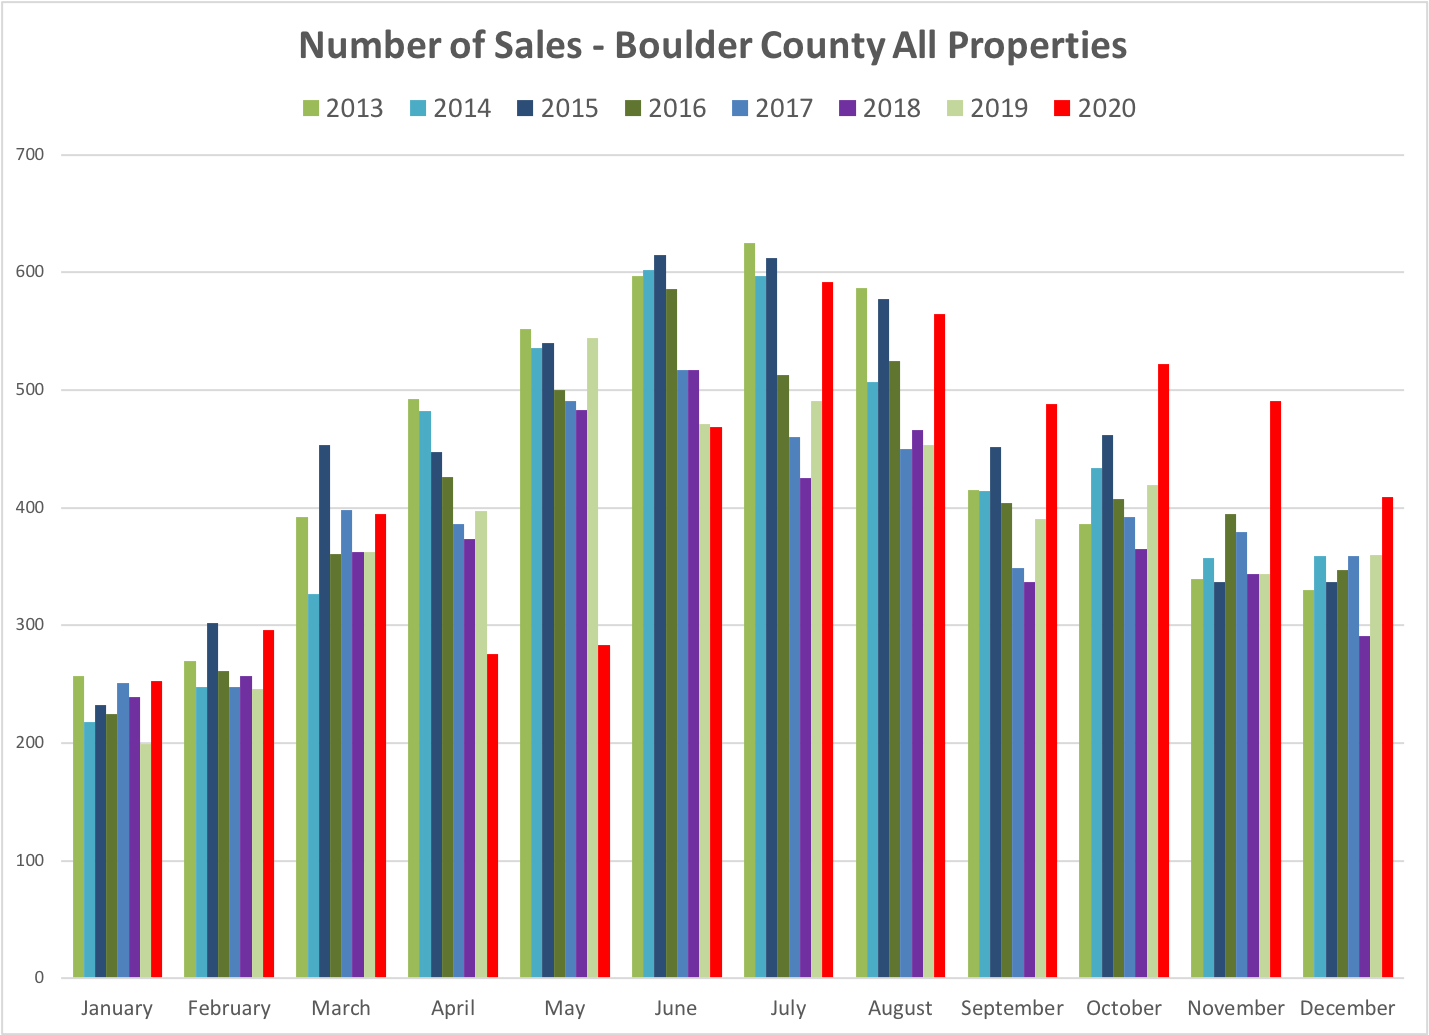
The graph above shows the entire year of sales in Boulder County by month. Each of the last five months of the year eclipsed each of the historical months of the previous five years.
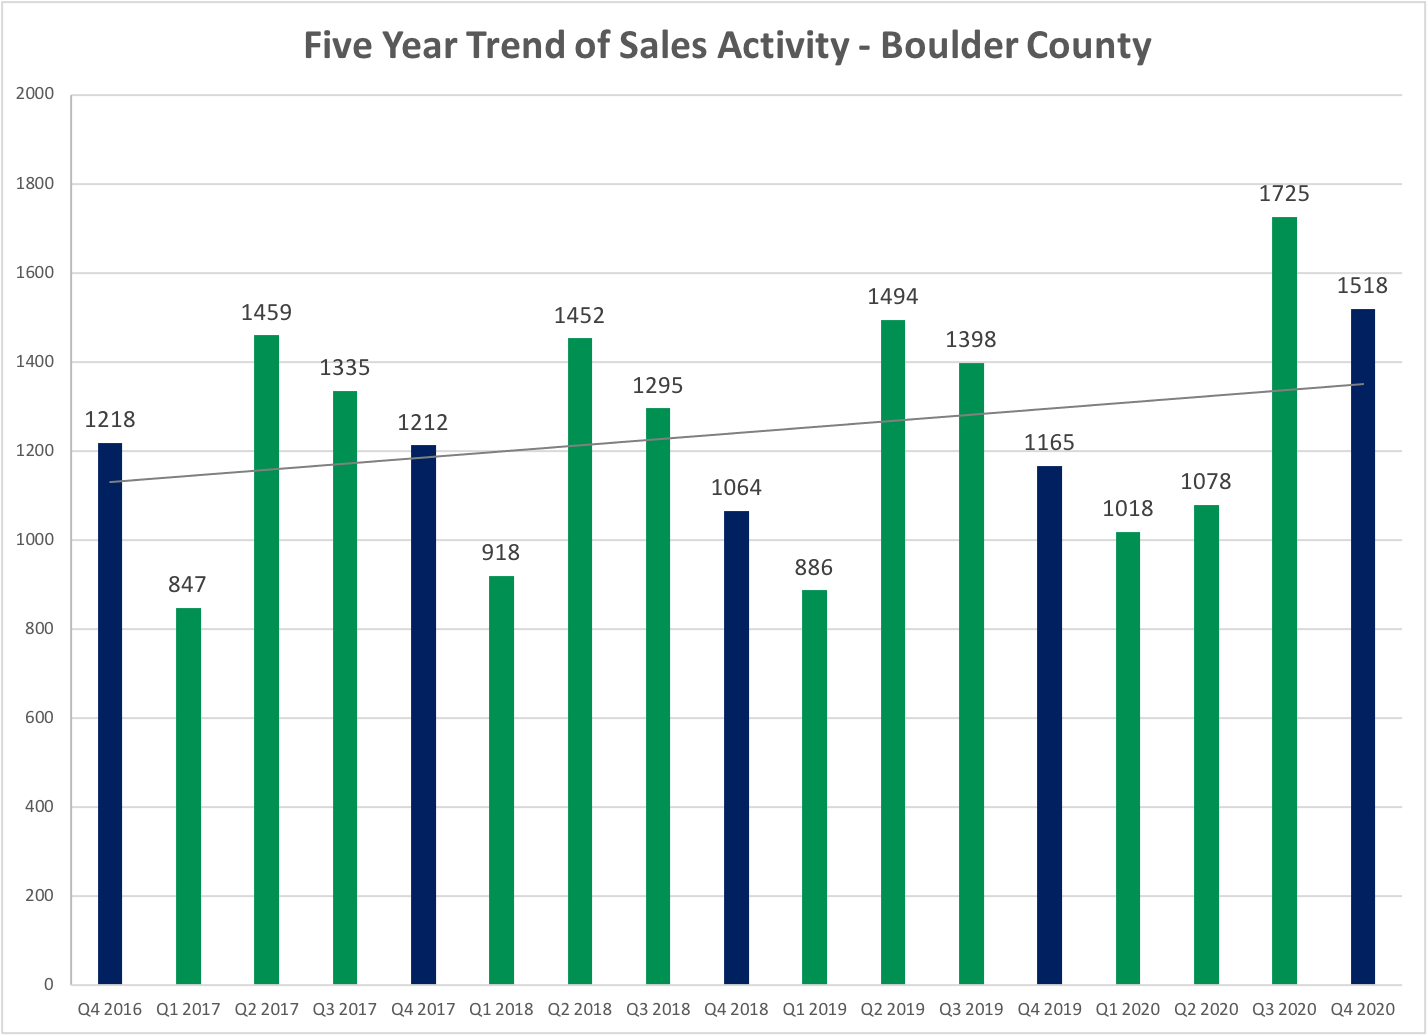
Sales on a quarterly basis tell much of the same story. But it’s interesting that the 4th quarter was the second highest in terms of total sales over the past five years. Second only to the third quarter.
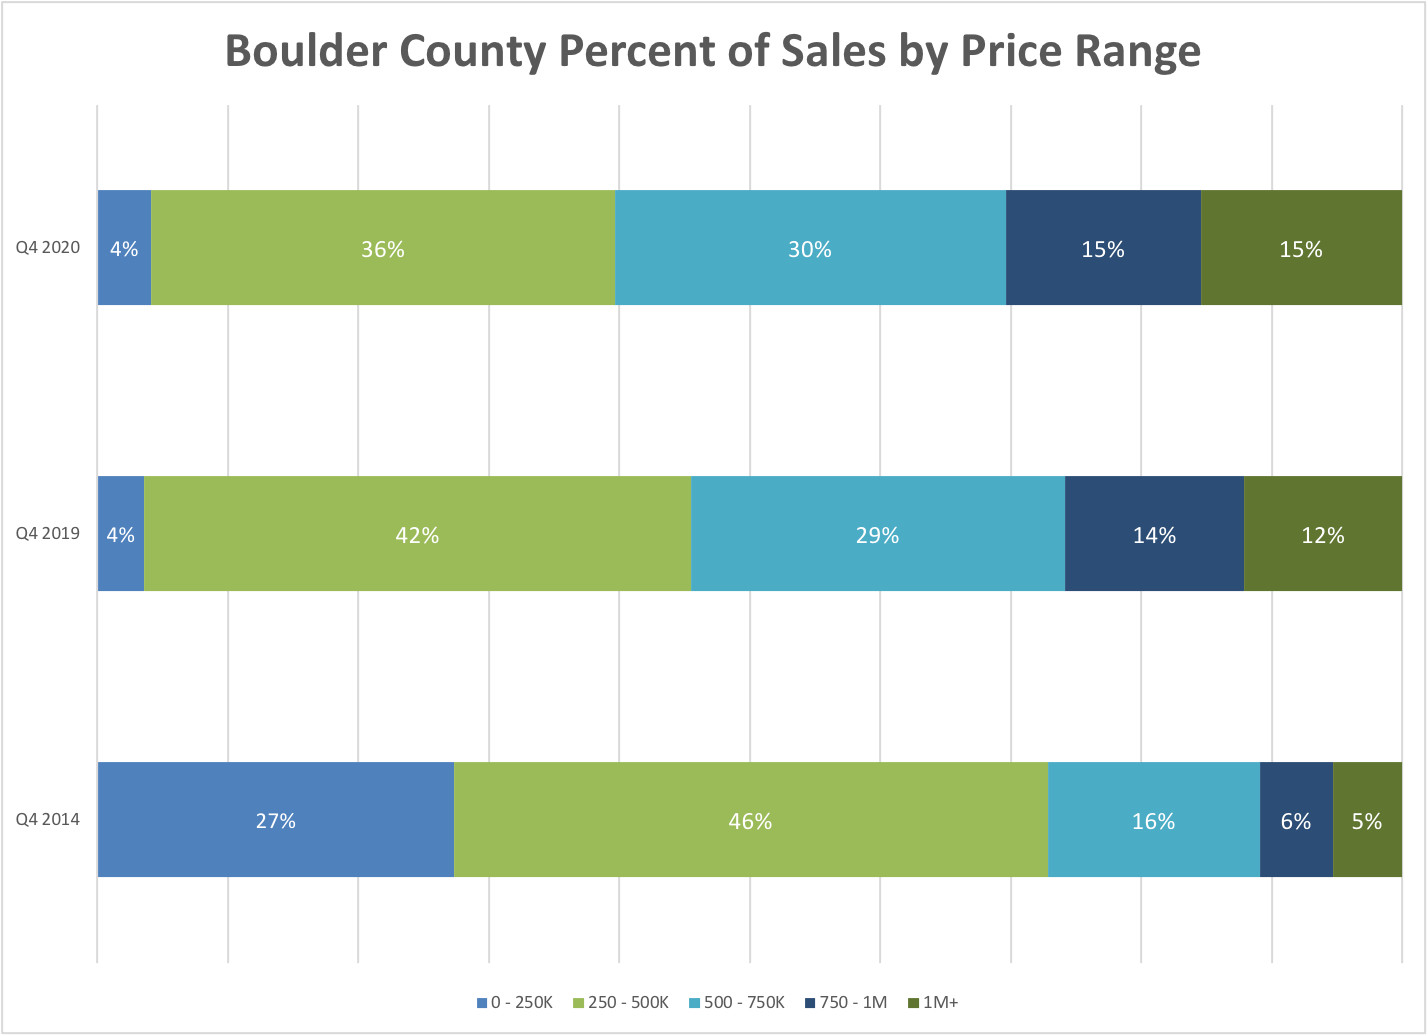
Not surprisingly, prices keep rising! The graph above shows the percentage of sales in each of the defined price ranges. The graph above compares the sales mix of the most recent quarter with the same quarter last year as well as with the same quarter five years ago. It’s easiest to see the upward shift in prices when comparing the $0 -$250 price range and the $1 million + price range. In 2014 27% of the sales in Boulder County were in the below $250,000 price range. This past quarter just 4% were in that price range. Inversely, 5% of the sales in 2014 were for $1,000,000 or more. This past quarter 15% eclipsed the $1 million barrier.
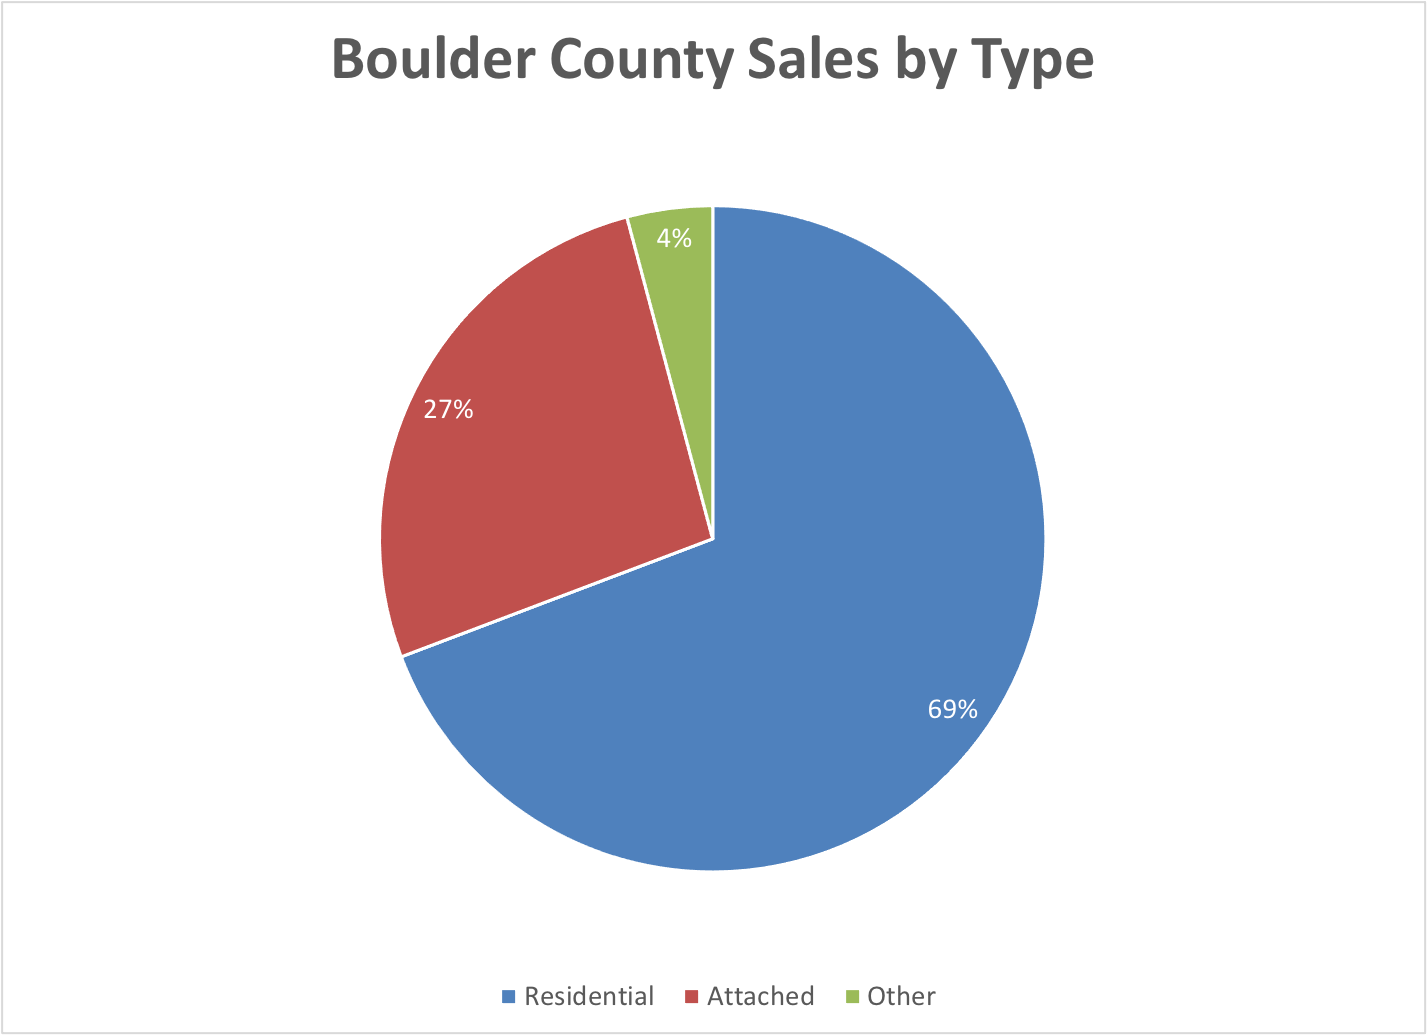
This past quarter 69% of the sales in Boulder County were classified as single family homes. 27% were townhomes or condos and 4% were investment properties, vacant land or farm and ranch. These numbers are fairly stable from year-to-year but the mix does vary within communities. For example, in the City of Boulder it is always near 50/50. In Longmont this past quarter the mix was 83% single family and 17% attached dwellings. In the east county communities the mix was 77% single family and 23% attached dwellings.
In the Kearney Report, I track key statistics on a quarterly basis over time in Boulder County, City of Boulder, East County Communities (Erie, Louisville, Lafayette, Superior) and Longmont. The report is always available and can be downloaded. An archive can be found by clicking here.

