by neil kearney | Jan 15, 2008 | Boulder County Housing Trends, For Sellers, Real Estate 101
The Real Estate Cycle
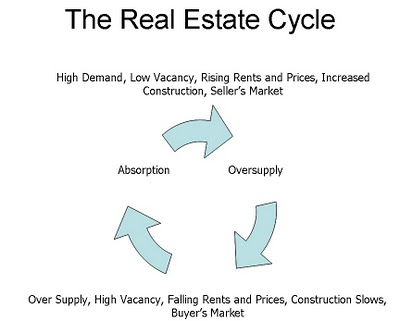
 I found this graphic on a power point slide I had put together a few years ago. Looking at it again, I firmly believe that we are in the “absorption” phase characterized by the arrow on the left side. Many of the symptoms of the bottom of the market have already happened and are improving. Rents have fallen but are now improving. Housing permits were down 26% last year. Vacancies have fallen, both in commercial and residential rentals.
It is still a buyers market and sales are not happening as quickly as some sellers would like but we are working again toward the top. Inventories are down and now is a great time to buy before prices spike again.
Have a great day!

by neil kearney | Dec 5, 2007 | Boulder County Housing Trends, Statistics
Boulder Improves in National Housing Study
The Office of Housing Enterprise Oversight (OFHEO) released their third quarter housing report last week. As a whole the United States housing stock declined in value for the first time since 1994. Locally we are making positive progress.

There are 287 ranked metropolitan areas in the U.S. and Boulder ranked 126th in 1 year home appreciation, with 3.06%. During the second quarter of this year we had a one year rate of 2.25%, which ranked us 185th in the country. They also track quarterly numbers. For the third quarter this year we had an appreciation rate of .14%, basically breakeven. This ranked us 127th. Of the 287 ranked areas, 83 had price depreciation during the quarter. We actually fell back a bit on the quarterly numbers. During the second quarter of this year we had an appreciation rate of 1.44%. This ranked us 46th in the country.
The one year appreciation rate for the United States was 1.79%, down from 3.19% reported in the second quarter. Colorado ranked 36th in annual appreciation with 2.23%. Last quarter we were ranked 37th with a 2.95% rate.
Remember that the real estate market is local. Even the numbers for Boulder can’t be characterized as one market. The Boulder MSA includes the entire county an there is certainly a difference between the rate of appreciation in Boulder and those in Longmont.
I will report on the top 20 and bottom 20 market in a later post.
Note: an city in Colorado is ranked #3 on the list for appreciation!
by neil kearney | Oct 31, 2007 | Boulder County Housing Trends, Statistics
Long Term Trends
Day-to-day it is sometimes easy to forget that real estate is a cyclical market. It is helpful to step back and look at a broader view. I recently compared sales, dollar volume, median price and sales price to list price ratio (average negotiation) from January to mid-October for the years 2000-2007 for all sales in Boulder County. Here is what I found.
- The number of sales has modulated. First it decreased right after 9/11. Then it increased to record highs only to have fallen since late 2005.
- The dollar volume has followed the same pattern but the curve is much more subtle due to the increase in median prices.
The median price has continued to rise at a rate averaging 4.6%.
The average negotiation has increased since 2000 but not as much as you might think. During the hot market of 2000 the average negotiation was 1.22%, now it is 3.05%.
by neil kearney | Oct 23, 2007 | Boulder County Housing Trends
Market Update
Through its first three quarters, 2007 has been a turbulent year. The real estate market has had its ups and downs as well. As you probably recall, we started out the year with a bunch of snow, colossal amounts actually, that chilled the early year sales and delayed the beginning of

our selling season. After we thawed out and convinced our out-of-town
buyers that we don’t usually get that much snow, the market chugged along at a pretty good clip during the second quarter. A few sellers were even lucky enough to sell their homes for over full price, a rare occurrence in today’s market! During the third quarter irrational exuberance in the mortgage industry came to an end. Mortgage companies were going out of business and borrowers who were not financially ready to buy a home were told that they “no longer qualify”. The era of easy money has come to a close and buyers need both income and a down payment in order to purchase a home. Go figure. The shake up in the mortgage industry has and will continue to affect the overall real estate market but I believe that this reality check will help us in the long run. It is not sustainable to have homeowners in homes they cannot afford. In the short term we will continue to see many foreclosures in some markets and fewer qualified buyers.
If you have been paying attention at all to the media you have heard this before. The thing about real estate is that it is NOT a national story. Real estate is a local phenomenon, neighborhood by neighborhood. The news headlines that proclaim “Real Estate Bust”, “Real Estate Bubble Bursting” etc. do not apply to us. Our real estate cycle seems to be on a bit of a different schedule than the majority of the county. We had our boom early, ending in 2001 or so. When the boom ended our bubble burst with a fizzle not a boom. We have been slowly leaking air over the past five years or so. Some areas in our market area have felt the discomfort that foreclosures and negative appreciation bring to an area. People do not plan nor feel comfortable with owing more than they can sell their homes for. Other areas in our market area have performed pretty darn well over the past five years. Our market is slower now, most sellers will tell you that they hoped for better results, but we have many things going for us in our area. We have a healthy local economy with low unemployment, good income and a population that is growing. People continue to move to the Front Range of Colorado and those people need housing. It is our belief that there is pent up demand waiting for good news on the real estate front. Most people are not required to move at any certain time. To most people an upward move is a luxury caused by a change in family or circumstances. Most of these people can wait a year or two or more if they don’t feel like it will be easy. Once we start getting a bit of good news about the real estate market the pent up demand will release and we will start to see some real strength.
As I mentioned briefly earlier, on a comparative basis with the rest of the country we are doing well. The latest report from the government Office of Housing Enterprise Oversight has the Boulder/Longmont area ranked 185th out of 287 areas with an annual appreciation rate of 2.25%. As of a year ago we had an annual appreciation rate of 3.55% which ranked us 218th. We are not improving but the other areas in the county are getting worse. So how are we doing? Here are a few details. Our sales through the first three quarters are down roughly 9% from last year. The median price for a single family home in Boulder County is $374,000 and $550,000 in the City of Boulder. On average it takes 76 days to get an offer. During July, each listing in our office averaged about 9 showings during the month. During September it was a little under 5 showings per house. None of the sales statistics include houses that don’t sell and there are many that don’t sell. Now is not the time to be an unrealistic seller. When there are dozens of homes to look at in your price range, buyers don’t care how much you owe or how much money you put into the basement. All they know is that they are not interested at the price you are asking. This brings up a couple of other interesting tidbits about our market. First let’s talk about the sales price to list price ratio. This ratio gives us the average negotiation off of the last list price. In our strong markets of the past, this ratio was around 98% or a 2%  negotiation. Right now the average is around 97% or 3% negotiation. What gives, it takes almost three times longer to sell a house right now but the amount of negotiation is largely unchanged. What this says to me is that buyers are unwilling to deal with unrealistic sellers. If the house is overpriced they move on and find another one that has the entire package, price, location and condition. The second interesting market fact is more anecdotal and goes hand and hand with the first one. Buyers are seeing more homes before they purchase a home. There is no real sense of urgency on the part of buyers and they are making sure they turn every stone before they make their decision. As we finish the year, sellers will need to make sure they are well positioned in the market and buyers will need to realize that the market is not as bad as you’ve heard.
So, how can I help? I care about my clients and do everything we can to help them accomplish their goals. I sometimes become property managers, finding short term tenants for vacant homes, I stage homes to make them attractive and inviting and do extensive marketing to reach prospective buyers. I am honest and thorough in advising our clients about current market conditions. Please call if I can be of help to you or your friends and family. I appreciate the opportunity to be of service.
by neil kearney | Oct 19, 2007 | Boulder County Housing Trends, Statistics
Quick Market Facts
- Median price of a single family home in Boulder County – $374,000
- Median price of an attached dwelling in Boulder County – $210,900
- Median price of a single family home in the City of Boulder – $550,000
- Median price of an attached dwelling in the City of Boulder – $239,000
- Average days to receive an acceptable offer in Boulder County – 76 days
- Number of months of all inventory in Boulder County – 7.5
- Current number of active listings in Boulder County – 3,179
- Number of those listings that are under contract – 374 (11.7%)
Our market is doing well when compared to many other markets around the country. But it is still competitive, 88% of all homes on the market have not yet found a buyer. It would take 7.5 months to sell all of the available inventory given our current sales rate.
Away from the stats for the moment I have noticed that the showing rate for my listings has increased this month when compared to September. Lots of buyers looking at many houses before they choose 1. I have also heard of many people in town for relocation trips, those are buyers for next year.
by neil kearney | Oct 8, 2007 | Boulder County Housing Trends
September Market Wrap-Up
We have been having beautiful fall weather, the Rockies and advancing in the playoffs and the Colorado Buffaloes are winning games, all is good!
The results are for September and the numbers are not as strong as I had hoped. Once again, total number of sales for the month the was lower than September 2006. Our market has been plodding along at a steady pace that much of the country would envy, but we are not keeping up with the last few years in terms of numbers of transactions. What this means is that the pool of buyers is smaller and this makes for a very competitive environment for sellers. Many good looking homes are going un-noticed. This forces sellers to either be very patient or very aggressive in pricing. My sense is that the majority of sellers in our market are the patient types. We see many price reductions on a daily basis but the overall median prices in the area are not dropping. See the charts below for details.


