by Neil Kearney | Aug 18, 2014 | Boulder County Housing Trends, Statistics
 I have just published The Kearney Report for the 2nd quarter of 2014. This 17 page report gives a detailed view of the real estate market in Boulder County as a whole as well as a view of each of the communities within the county.
To view or download the report for free click here. Kearney Report 2nd quarter 2014
As I analyzed the sales results for the second quarter, the numbers didn’t seem to reflect the market. The number of sales was down slightly (2.7%) but that is like hearing a World War I report that casualties were down slightly and pretending to understand what is going on. More relevant to the understanding of the local real estate market are “Days to Offer”, “Sales to List Price Ratio” and “Median Sales Price”. I will go through each in order.
Days to Offer
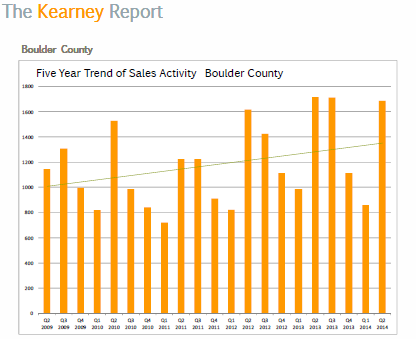
When someone says that “the real estate market is good”, I think they are referring to the perception of how long it’s taking for their neighbors houses to sell. The technical term is “Days to Offer” as opposed to “Days on Market” which includes the time the house took to go from contract to closing. Days to offer begins when the property goes on the MLS and continues until it is marked as under contract or pending. When I get the question asking how long it’s going to take to sell their home, this is what they mean. During the second quarter, the average Days to Offer of all properties in Boulder County was 31. Of course there were many homes that sold almost immediately (in practice, even if an offer is received on the first day the DTO will be 3 or 4 because it takes a bit of time to negotiate and get the paperwork done) but an average of one month is truly fast. Last year was a similar market and the DTO was 42. In 2012, it was 74, 2011 it was 89 and in 2010 it was 77. This year the inventory was low and with housing flying quickly off the market the problem was exasperated.
Sales to List Price Ratio
A seller can put any price they want on their home. You see it all over Zillow with their “Make me Move” feature. Joe Homeowner in a fit of especially clear thinking one night at 3 am signs up for the service by listing his home which is worth $250,000 for $499,000. What the heck, maybe someone from China will come in and pay cash. He’ll let his wife in on the big plan once the dream comes true. Usually once a home seller meets with a Realtor and actually lists their home on the MLS the hazy reasoning that a buyer might pay $499,000 has lifted and clearer heads and data have prevailed. Still there, it is common for a seller to want to ask that extra 5% to “see what will happen”. In a normal market buyers see the premium price for what it is and wait for the price to come down. In a frenzied market, like the one we had this spring, buyers tend to quickly justify a reasonable price jump and pay at or near the list price. Traditionally, in the Boulder area the ratio between the sales price and the listing price has been around 97%. This means that the average negotiation is around 3%. This year for all sold properties in Boulder County the sales price to list price ratio was 99.01%. This means that the average negotiation was 1%. Included in this figure were all of the homes that sold for over full price. By any measure, this is a sellers market.
Median Sales Price
How much ones home is worth is a big component about how one feels about their overall financial picture.
Houses selling quickly and for near their asking price are strong indicators for the more important measure of Median Sales Price. Over the past two springs, housing prices have increased. How much is localized to each neighborhood/home and coming up with an overall figure is fraught with some pitfalls. So far this year more homes are selling in higher price ranges. Is this a measure that all prices are rising or is it that more “high end” buyers are purchasing homes and thereby bringing up the average. It could be both. FHFA.gov measures same house sales which eliminates this problem. FHFA.gov reported the 1 year appreciation ended March 31st for Boulder County to be 8.1%. I would expect that number to increase for the second quarter.
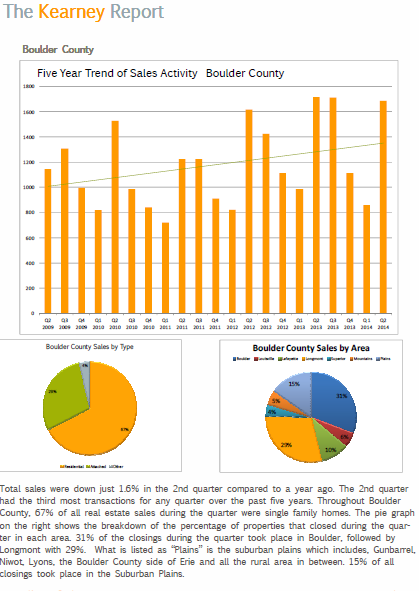
As you browse through the rest of the attached report you will find a number of market measures displayed for smaller areas within our market. Boulder and Longmont have the most sales in the area but the real estate markets in those areas are very different. Enjoy the report!
by Neil Kearney | Jul 10, 2014 | Boulder County Housing Trends, Statistics
It’s been a crazy busy summer for me. Which is great, but not so great in terms of reporting statistics and market reports. Here are the latest stats from the sales in Boulder County through June. So far this year sales are down 6% from last year but up 3% from 2012. Overall a good year. We are still struggling with overall low inventory but I’m seeing some improvement on this. Multiple offers have been common this spring (the most I’ve participated in was 13) and prices are rising. Check out the slideshow to see all of the statistics.

by Neil Kearney | May 20, 2014 | Boulder County Housing Trends, Statistics
The major theme for the first quarter were low inventory, lower sales and increasing prices. Since the end of March the market has only seen these factors increase. Multiple offer situations are very common. In fact in the past week I have had two buyers miss out on desirable properties. One house in Boulder had 13 offers on it. My buyers put in a bid 15% higher than the asking price and didn’t get it! The other was a house in Lafayette that had 4 offers on it. They offered 3% higher than the list price and came in second place. It’s a bit crazy out there right now.
Enjoy the report. Kearney Report 1st quarter 2014.
by Neil Kearney | Apr 8, 2014 | Boulder County Housing Trends, Statistics
The first quarter is in the books and this quarter there were 14% fewer sales than a year ago. Inventory lagged all quarter. Prices seem to be rising again mostly due to the lower inventory and the still good demand in most areas.
Please scroll through the slideshow above to get more details on the market. Here are the main take-aways this month.
- Sales in March were 16.6% lower than the same month last year.
- Inventory continues to be very low however we have seen some recent improvement in this measure. Maybe all of the sellers were waiting for spring.
- Multiple offers are very common on new listings.
- The spring buyers are starting to think about real estate and for most there is not much on the market to see. Very difficult of out-of-town buyers.
by Neil Kearney | Mar 17, 2014 | Boulder County Housing Trends, Boulder Real Estate, For Buyers, For Sellers
Where Did All The Homes For Sale Go?
It seems that the headlines around the country in stories written about real estate inevitably have two major themes; low inventory and increasing prices. And for anyone who is familiar with economics at all this isn’t a surprise. They should go hand in hand. Given equal demand, a decrease in the supply of any good will result in an increase in the price of that good. The technical term is scarcity. It results not only in a buyer paying more for something but in most cases they also have to demonstrate patience as they wait for delivery. But this equation doesn’t always end up with the same number of transactions taking place. Many of the would-be buyers get discouraged with the process of the purchase and decide to make other arrangements.
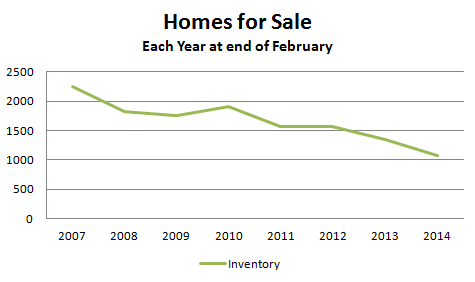
In the real estate world “other arrangements” mean that a would-be buyer decides to stay where they are or decide to rent instead of buying a new home. The market isn’t operating efficiently and in the end, the result is fewer sales. We are already seeing all of these variables come into play: lower inventory, higher prices, fewer sales. Here in Boulder County inventory is down approximately 50% from the same point five years ago.
The question that I haven’t seen adequately answered is “where did all the homes for sale go?” I don’t have ‘the’ answer but here are my ideas on the reasons why inventory of homes for sale has steadily decreased both nationwide and locally.
- Financial Distress – When homeowners don’t have enough equity or cash to sell a home they have three choices; pursue a short sale, let the home go into foreclosure or keep making the payments and hang on to the house until their equity rises to a point where their costs to sell are covered. Prices have risen and we are through the worst of the latest foreclosure wave but the most recent recession was deep and home prices did fall to a point where the recent appreciation in many areas is just now making up the accumulated loss. If you bought in 2005 – 2007 chances are that your equity vs. selling cost equation is still about breaking even. Therefore, the mindset for many people is, that I have made it this far and prices seem to be headed in the right direction so if I hold on a bit more it will be even better. Many in financial distress either can’t afford to sell or are waiting for more appreciation.
- Trade-up Conundrum – For homeowners hoping to trade-up to a larger, more expensive, or different house there are two parts of the equation, selling and then buying. Right now the selling part is easy. In the Boulder County area if you have a decent house you can sell your home for a good price in fairly short order. But once you sell you must find a new home, and fast. There are two problems here. 1) Low inventory means that a buyer has very few choices on the buying end and it might take a double move to make it work. 2) Prices are rising and there might not be enough equity (see #1 above) to put into the new home to make the financing and monthly payments work.
- Investment Buyers – When a new listing does come on the market competition between buyers is tight. Exasperating this competition is the proliferance of investors who many times make cash offers. More buyers means that it takes even more new listings to satisfy the demand.
- Rising Prices – I had a prospective seller do some quick math at the kitchen table recently. He knew that prices had risen approximately 9% over the past year on his $500,000 home. This meant that every month his home was going up another $3,750. There are some serious assumptions in this equation, but I don’t doubt that many homeowners do the same math. The answer to this optimistic equation for them is “let’s stay here another year and sell it next year for $50,000 more”. I love the optimism, but this type of thinking doesn’t work in perpetuity. If you follow the housing market, the stock market, the commodity market or any other free market, you know that these forward looking assumptions are easier to make than they are to collect on.
- No Place To Go – “Sure we could sell our house, but where would we go?”. These words are echoing across the area, and alas the nation. Instead of taking the plunge into the market, these would-be sellers/buyers then decide to do nothing, thereby fueling the self-fulfilling spiral of even lower home inventory. In our area this is further exasperated by a lack of rental homes that in a different market take up the slack if the logistics don’t work just perfectly.
by Neil Kearney | Feb 14, 2014 | Boulder County Housing Trends, Statistics
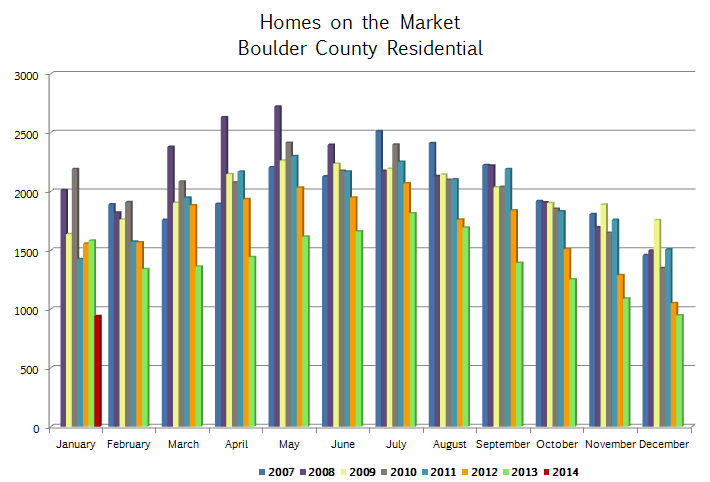
This year, the real estate market in Boulder County is getting off to a measured start. Sales were down 15% compared to last year during the month. Given that last year we were off to such a quick start, this is not too surprising. But what is concerning is the continuing trend of low inventory. The graph below shows the current (as of January 31st) inventory of available listings in Boulder County over the past six years. The current month is represented by the short red stick on the left hand side. If you are a buyer the pickin’s are pretty slim.
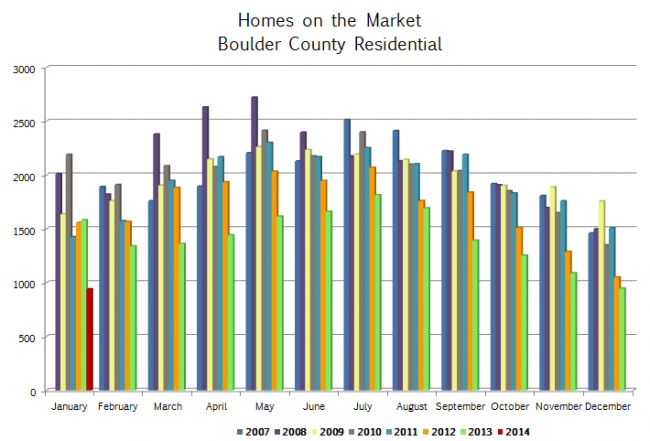
To see more market statistics in detail please browse through the slideshow below.

 I have just published The Kearney Report for the 2nd quarter of 2014. This 17 page report gives a detailed view of the real estate market in Boulder County as a whole as well as a view of each of the communities within the county.