by Neil Kearney | Jan 13, 2015 | Boulder County Housing Trends, Statistics
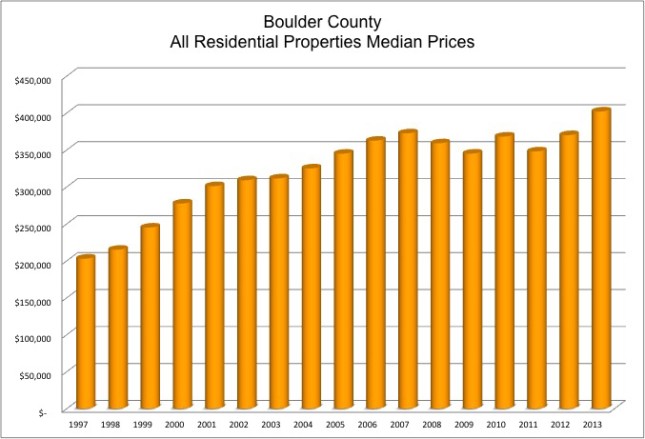
The calendar has made the switch and now is the time that I’m crunching numbers and getting ready to release my year end reports. One figure that everyone is always interested in, is the change in home prices. For the third straight year we have seen positive home value appreciation in Boulder County. The median price for a single family home in Boulder County increased by 8.6% over last year. Condos and townhomes increased by a more modest 3.8%.
These figures just compute the midpoint of all relevant sales so it is only an indicator of the market not an actual statistic for any individual property.
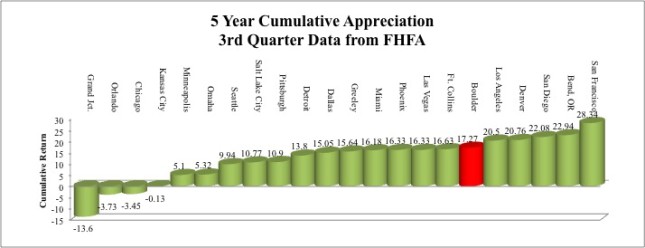
FHFA.gov is the government agency that oversees the housing and mortgage markets. They track home values and produce a report on a quarterly basis. Their ongoing study tracks same house sales. This means that they only count houses that they can track over time. This gives a more accurate number than just taking the median. The results for the fourth quarter are not published yet so the information below is based on their statistics through the third quarter.
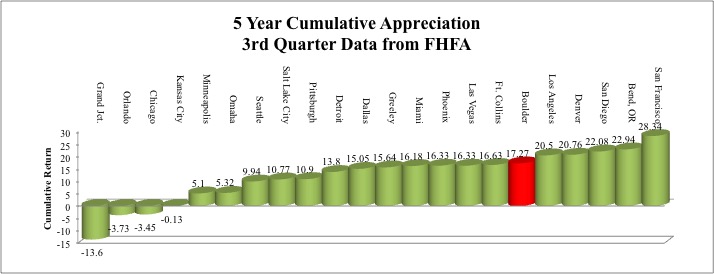
The first graph below uses FHFA.gov data and shows how prices in Boulder County compare to 21 other areas around the country over the past five years. Boulder is indicated in red. Over the past five years the average home price in Boulder County has appreciated by 17.27%. The returns are ranked from lowest to highest from left to right. Homes in San Francisco have appreciated by 28% during the last five years.
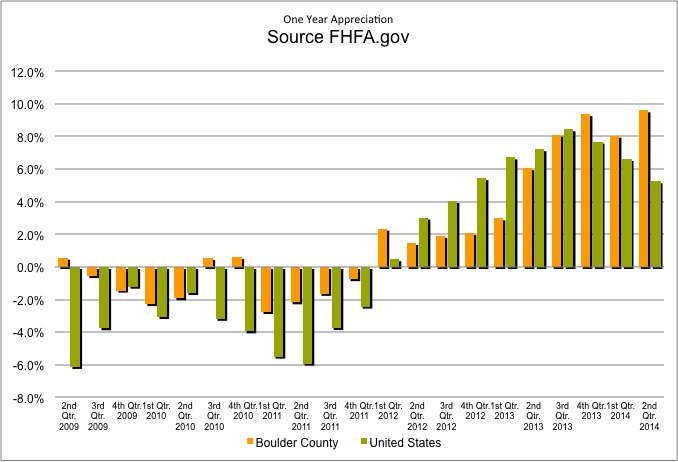
The next graph shows the last five years of price appreciation in Boulder County and the US average reported on a quarterly basis. FHFA.gov reports that Boulder County has seen 8.35% appreciation for the one year period ending on September 30th. Our market went down quite a bit less when values dropped and has gone up more than the national average. This is the sign of a good investment.

by Neil Kearney | Jan 7, 2015 | Boulder County Housing Trends, Statistics
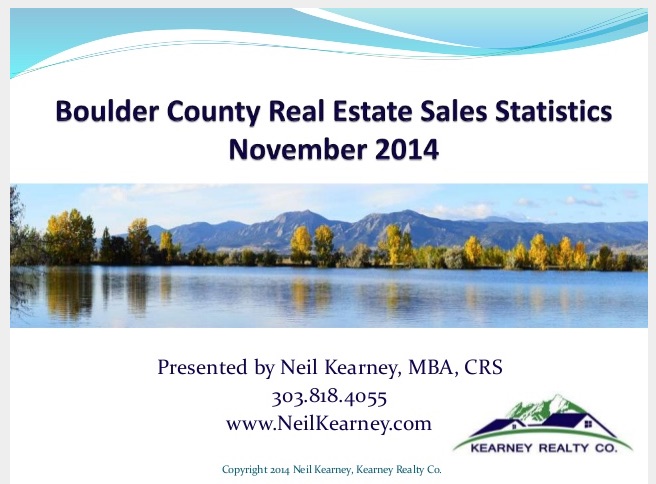
December was a strong month in the local real estate market. Sales in Boulder County were up 8.8% compared to last December. This strong result helped bring the year end sales total to just 3% behind 2013. Inventory of homes on the market continues to be a concern. At the end of December there were just 579 properties on the market in Boulder County that were not already pending. This is the lowest figure since I have been tracking it. Hopefully there are many sellers getting their homes ready to sell this spring. The demand is there and sellers have seen good appreciation over the past three years. The slideshow below gives a detailed view of what has happened in the Boulder area real estate market over the past four years.
by Neil Kearney | Dec 21, 2014 | Boulder County Housing Trends, Statistics
Residential real estate sales in November were up 5% from a year ago but down 18% from October. The drop off in closings is normal this time of year. Year-to-date, sales are down 4% from last year and up 5% from 2012. The inventory of homes on the market continues to be very low. The slideshow below gives detailed information about the sales activity, under contract percentage and inventory levels. It also shows activity levels by month and week over the past four years.
by Neil Kearney | Dec 11, 2014 | Boulder County Housing Trends, Boulder Real Estate
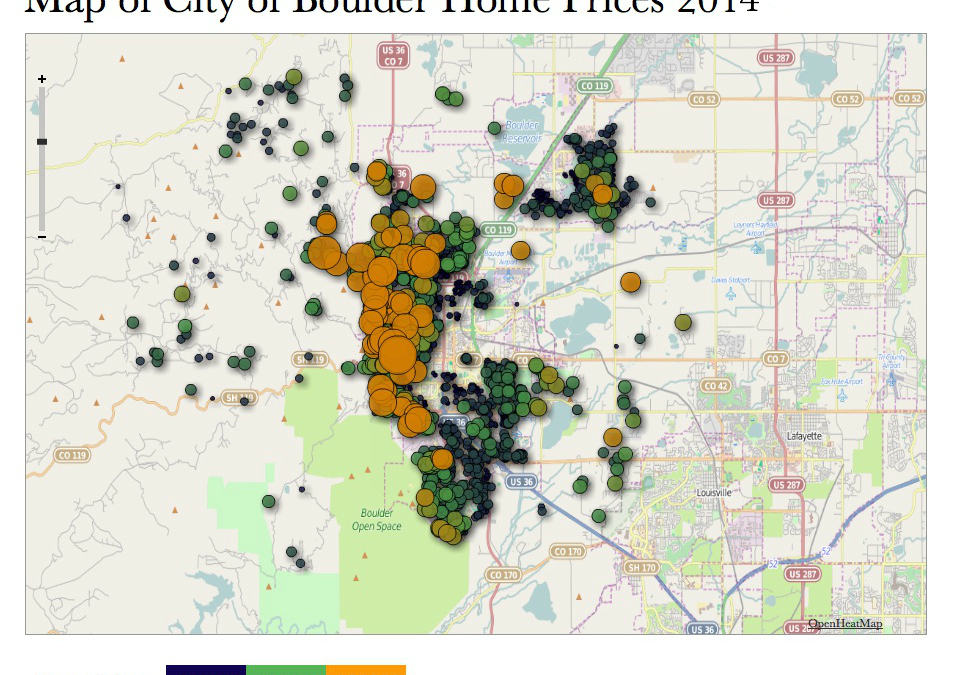
I’m revising my Boulder Neighborhood Guide and thought it would be helpful to show not only where sales are taking place but at what price. I found a way to manipulate the sales data for the City of Boulder and show it on a map and label it by price range. It’s called a heat map.
The first one shows all of the sales of houses and condos in and around Boulder in 2014. It’s a little busy, but you can generally see that there are more large orange circles on the west side of town. Orange circles represent the highest 1/3 of prices. Medium green circles represent the middle third and small blue circles stand for each sale in the lowest third of the price array. When there are a bunch of sales in close proximity the sales are bunched together and the circle becomes larger. You can see some normal sized circles on the east side of the map. So far in 2014, the City of Boulder and the close surrounding area has had 1,698 sales with a median price of $475,000. To see a larger view of each map, just click on the picture.
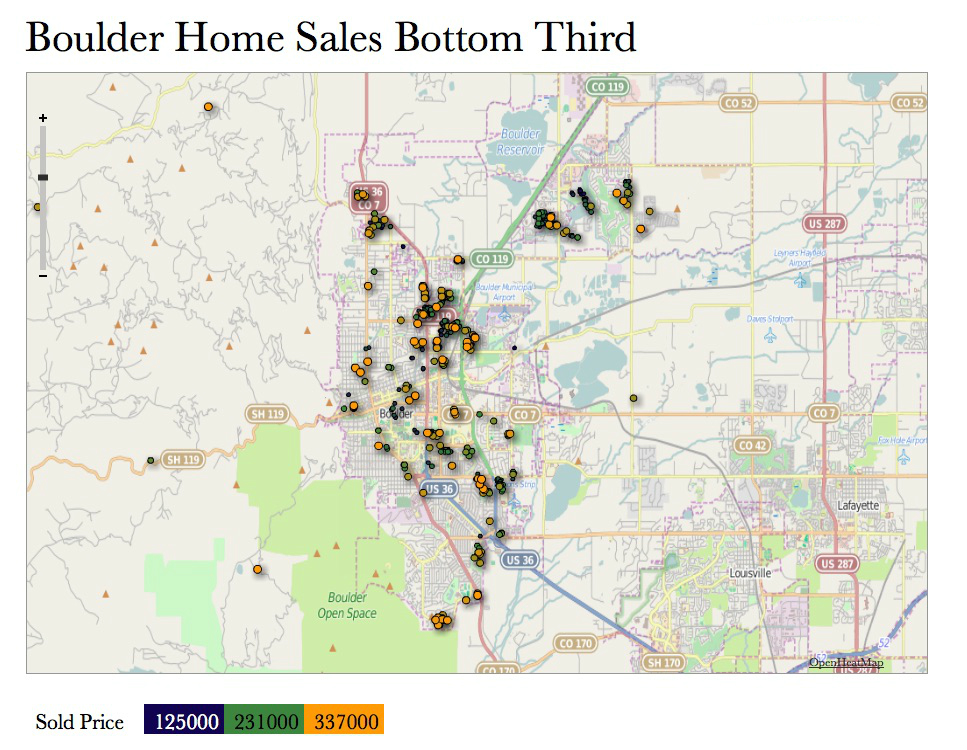
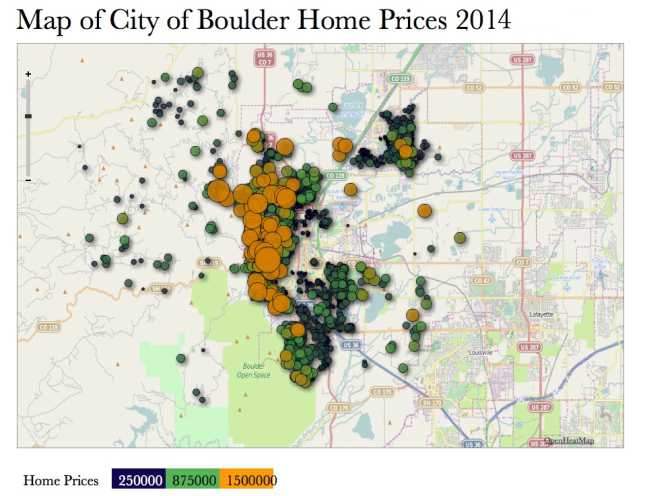 In order to see what is happening a bit clearer I’ve split the data into thirds. The first map below shows the sales in the Boulder area up to $350,000. This is the bottom one third of the market. Within this market segment the blue dots are the least expensive, the green dots are the middle segment and the orange dots are the most expensive segment. You can see that most of the sales are centered around 28th Street which is the main north south artery in town.

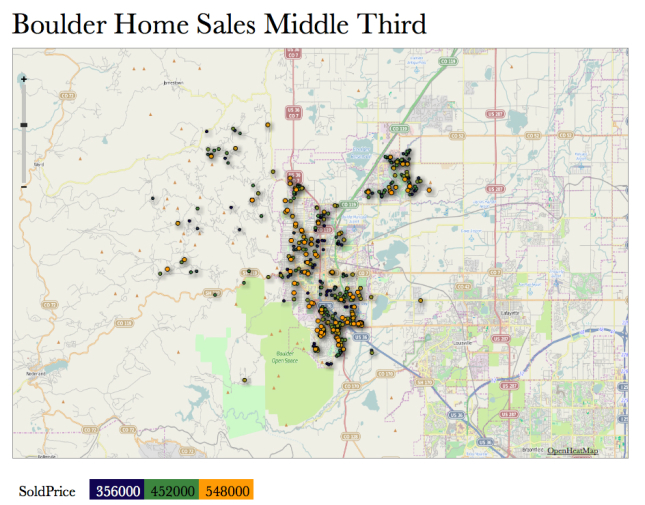
The middle price range in Boulder during 2014 are those properties selling between $350,000 and $560,000. In this price range there are quite a few more sales west of 28th Street, more in South Boulder (Table Mesa, Martin Acres) and more sales in Gunbarrel.
The last map represents the upper third of the price range; between $560,000 and $5,300,000. The map shows that most of the sales in the upper price range take place west of Broadway.
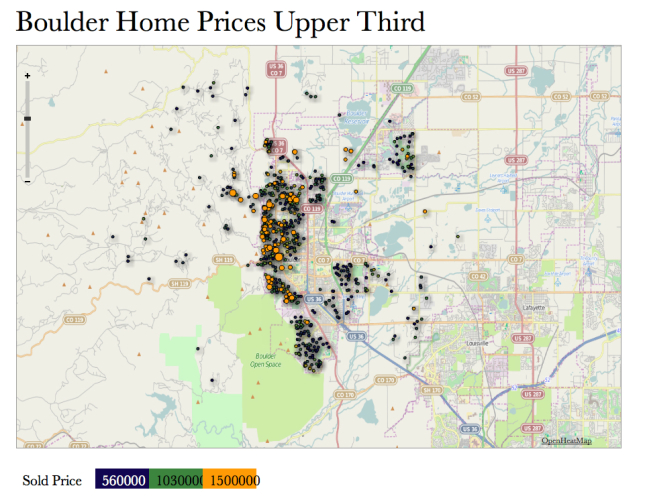
The heat maps were created at OpenHeatMap.com with data supplied from IRES MLS.
by Neil Kearney | Nov 13, 2014 | Boulder County Housing Trends, Statistics
The real estate market in the Boulder area was a bit sluggish in August. But once school started there was a surge of activity. The showing and contract activity in September led to a nice increase in closings during October. In fact sales were up 12% from a year ago. Home inventory remains low and year-to-date sales are down roughly 5% from a year ago but 6% above 2012. The quick presentation below shows the market in graphs, comparing the last four years of data on a monthly basis.

by Neil Kearney | Nov 4, 2014 | Boulder County Housing Trends, Colorado Lifestyle
 When you think of luxury real estate in Colorado you may immediately think of Aspen, Telluride or Cherry Hills Village. But increasingly, the Boulder area is legitimately in the conversation for those who have the resources to have a dream home in whatever location they choose.
People are drawn to Boulder for many reasons including; a good climate with four seasons, the fact that it’s a vibrant college town, tons of options to live an outdoor active lifestyle, it’s within one hour to a large international airport and 20 minutes to an airport that can easily handle private jets, ample cultural and sporting events, a plethora of really good restaurants, it’s a hotbed for entrepreneurs, and an overall positive liberal mindset where it’s okay to have money. It’s been said that birds of a feather flock together and more and more we are seeing this in and around Boulder.
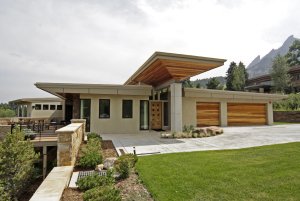
Another key feature to the attractiveness of the Boulder Valley to luxury home buyer is the breadth of home choices. Whether one prefers a penthouse with a view, a first rate equestrian ranch, an expansive mountain lodge, or an in town Victorian it is all available. All of these choices can be purchased within a 20 minute drive (at most) of downtown Boulder.
Properties listed between $1,000,000 and $2,000,000
Properties listed between $2,000,000 and $3,000,000
Properties listed for $3,000,000 and more
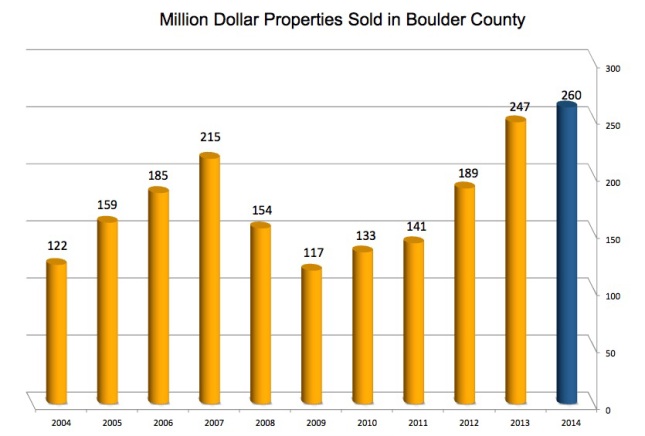
 In 2013 there were 247 sales in Boulder County which exceeded $1 million. The total volume of those sales was $389,350,340. So far in 2014 222 luxury homes have sold. As usual and not unexpectedly the majority (147) of those sales are between $1 and $1.5 million. So far there have been 28 sales of $2 million or more and $8 above $3 million. There have been two sales over $5 million so far this year. The top sale was for a beautifully restored, 7,600 sq. ft. Victorian on Mapleton Hill which sold for $6,432,495. The next highest sale was for a 5,200 sq. ft. penthouse in Downtown Boulder with amazing Flatirons views. Click here to view the photos and details of these properties.
Currently there are 20 homes on the market with a list price of over $5 million. So if you are in that price range make sure you plan a few days to look at the options. Currently three of these properties are under contract. The three that are waiting to close are a good example of the diversity of the choices in and around Boulder. There is a Penthouse Condo at 1155 Canyon listed for $5,330,000, a 6 acre wooded parcel right in town listed for $5.2 million and an eclectic mountain custom home with fantastic features at 1133 Timber Lane which is listed for $9.8 million. Look for these to close by the end of the year. Click here to view all of the homes in Boulder County with list prices above $5 million.
There are currently ten properties listed above $6,500,000 with the most expensive being a 144 acre compound with a 24,000 square foot main house and a full equestrian setup. Here are the top ten most expensive homes listed in Boulder County.
If you broaden the range a bit there are 252 homes currently on the market with list prices above $1 million. Forty-nine of those listings are under contract, so if over half of those homes which are already under contract close by the end of the year, Boulder County will have a record year in terms of sales over $1 million. Below is a graph of sales over the last ten years. 260 is my projection for 2014.
 If you are considering buying a home in high end of the Boulder real estate market you will want to do your due diligence. While most of the Boulder market is a sellers market, some quick math shows that there is roughly a years worth of inventory on the market in the broad range and over three years of inventory available in the ultra luxury category. You will need a good buyers agent to navigate you not only through the available choices but through the negotiation and due diligence period. I am experienced and available to you.
Here are a few quick facts about this market segment:
- The average Days-to-Offer for those that have sold so far this year over $1 million is 75 days.
- The average Days-on-Market for all homes actively listed over $1 million is 166 days.
- The above statistics show me that the exceptional homes don’t stay on the market long.
- The average negotiation off of list price for all luxury homes sold so far in 2014 is 4.22%.
- The average negotiation off of list price for properties sold between $1 and $2 million is 3.65%.
- The average negotiation off of list price for properties sold between $2 and $3 million is 4.63%.
- The average negotiation off of list price for properties sold over $3 million is 8.48%
- The median price for sales over $1 million sold so far in 2014 is $1,344,300.
- The average price for sales over $1 million sold so far in 2014 is $1,624,550.
The above data was compiled from data supplied by IRES MLS and is deemed reliable but it may not be exhaustive. All links were active and correct as of November 4, 2014.