
Boulder County Has One of the Most Consistently Strong Real Estate Markets In The Nation
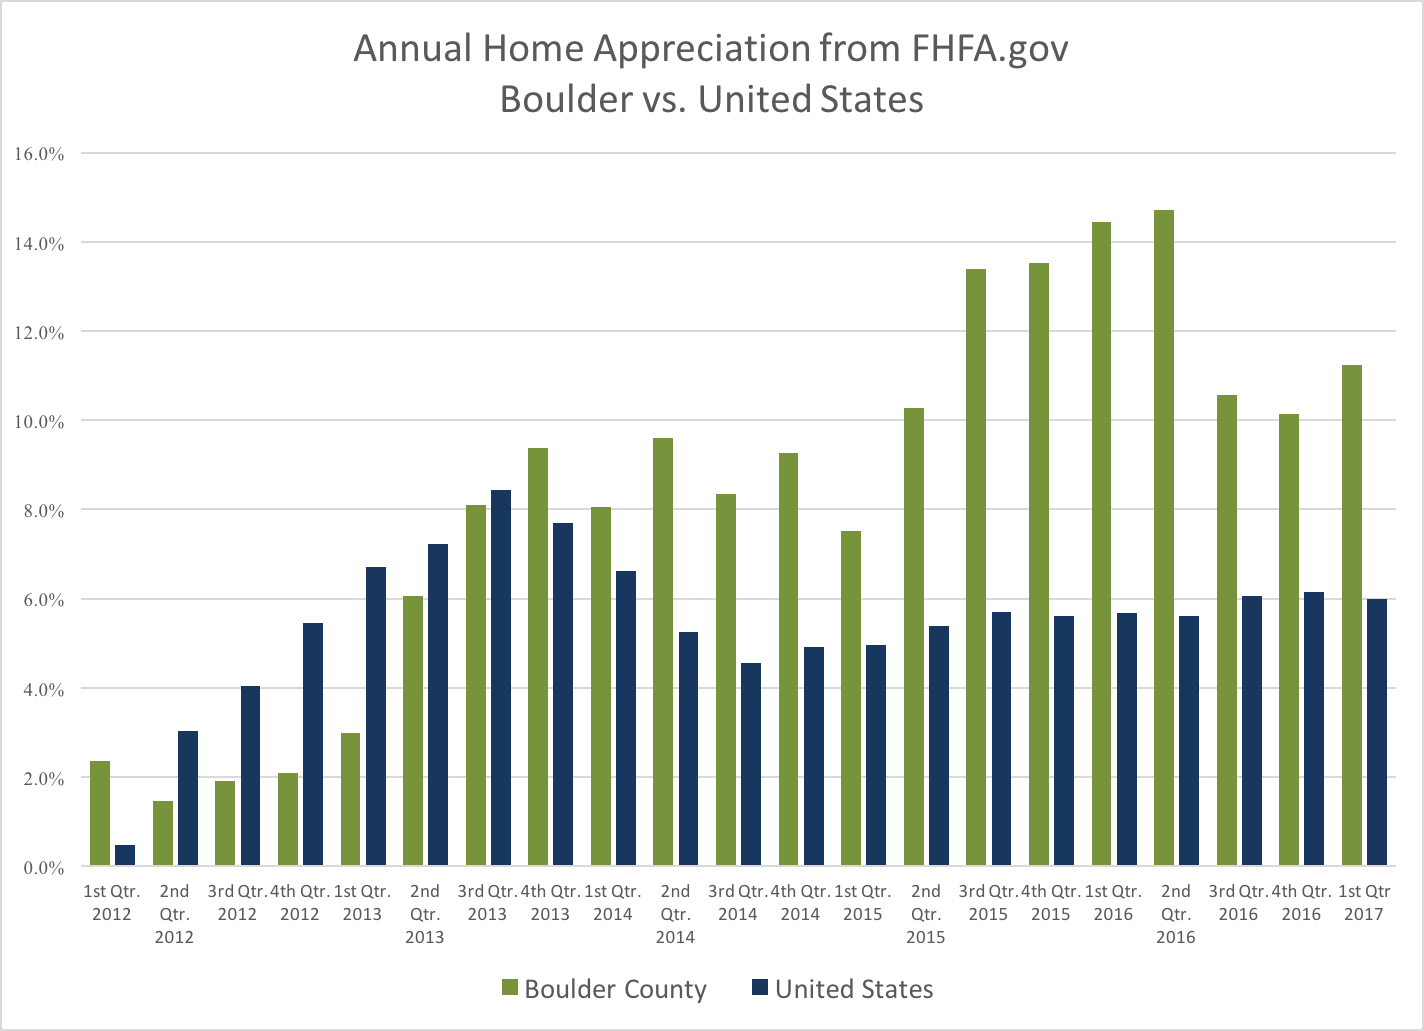
According to the most recent FHFA.gov Home Price Index quarterly report the one year appreciation in Boulder County for the period ending March 31, 2017 was 11.23%. This ranks us 12th highest in the nation out of the 257 largest Metropolitan Statistical Districts that were studied. Our area has been ranked in the top 15 for eight straight quarters including a #1 ranking for the period ending June 30th 2016. The first chart below shows the annual appreciation reported on a quarterly basis for both Boulder County (green) and the United States average (blue). The last five years have been one of our strongest “bull runs” in our history. Over the past five years, the average home has appreciated 55%.
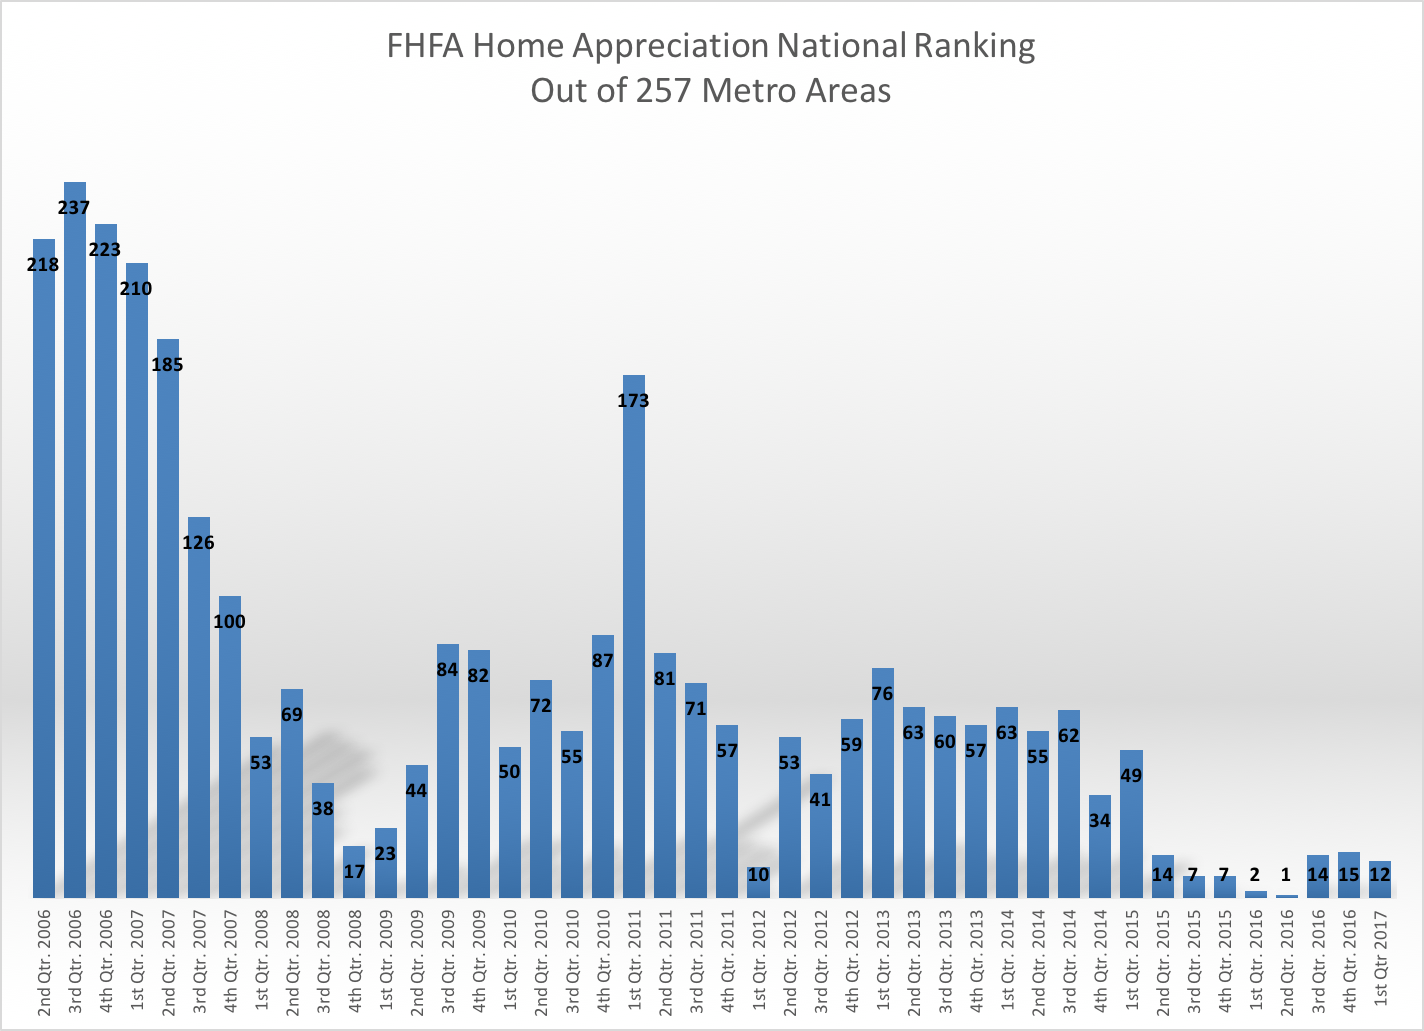
The chart below shows our national ranking compared to the 257 other markets in the FHFA report since 2nd quarter of 2006. This is an interesting graph because it shows that just before the economic downturn in 2008 our market was actually in the last quartile. Our annualized returns at that time were in the 1 to 3% range. As the downturn started and the real estate market came to a grinding halt our ranking improved compared to the rest of the country. During 2008 our appreciation remained above +2%. From 2009 – 2011 our average annual appreciation ranged from +2% to -2.8%. It turns out that we were one of the most stable markets in the country.
This got me to thinking about how we compare to other currently “hot” markets over the last 5 and 10 year time frames. First I identified the areas that currently are ahead of Boulder County in appreciation over the past five years. With 55% appreciation we are ranked 28th in the nation. Reno, NV is ranked #1 with 86% appreciation over the past five years. Here is the list showing the ranking over the past five years. The table is sorted by the highest to lowest in the bolded column.
| City | 2007-2012 Appreciation | 20012-2017 Appreciation | 10 Year Appreciation | |
| Reno, NV | -51% | 86% | 35% | 1 |
| Modesto, CA | -58% | 84% | 26% | 2 |
| Stockton, CA | -57% | 82% | 25% | 3 |
| Bend, OR | -43% | 79% | 36% | 4 |
| Las Vegas, NV | -60% | 78% | 18% | 5 |
| Merced, CA | -61% | 75% | 14% | 6 |
| San Francisco, CA | -21% | 73% | 52% | 7 |
| Oakland, CA | -35% | 73% | 38% | 8 |
| Santa Rosa, CA | -37% | 69% | 32% | 9 |
| West Palm Beach, FL | -46% | 69% | 23% | 10 |
| Napa, CA | -40% | 69% | 29% | 11 |
| Port Lucie, FL | -52% | 68% | 16% | 12 |
| Yuba City, CA | -49% | 67% | 18% | 13 |
| Sarasota, FL | -47% | 67% | 20% | 14 |
| Cape Coral, FL | -50% | 67% | 16% | 15 |
| Phoenix, AZ | -48% | 67% | 19% | 16 |
| San Jose, CA | -23% | 66% | 43% | 17 |
| Salinas, CA | -51% | 66% | 14% | 18 |
| Sacramento, CA | -43% | 64% | 21% | 19 |
| Miami, FL | -46% | 64% | 18% | 20 |
| Denver, CO | -5% | 62% | 57% | 21 |
| Riverside, CA | -49% | 62% | 14% | 22 |
| Palm Bay, FL | -47% | 62% | 15% | 23 |
| Portland, OR | -22% | 59% | 36% | 24 |
| Boise, ID | -36% | 58% | 22% | 25 |
| Daytona Beach, FL | -49% | 57% | 8% | 26 |
| Greeley, CO | -13% | 57% | 44% | 27 |
| Boulder, CO | 2% | 55% | 56% | 28 |
Now here is the list sorted for the previous five year time period 2007 – 2012. This represents the end of a bull market in many areas and then through the heart of the housing recession. During this time period Boulder is ranked #1 with 2% appreciation, Denver is ranked #2 with -5%.
| City | 2007-2012 Appreciation | 20012-2017 Appreciation | 10 Year Appreciation |
| Boulder, CO | 2% | 55% | 56% |
| Denver, CO | -5% | 62% | 57% |
| Greeley, CO | -13% | 57% | 44% |
| San Francisco, CA | -21% | 73% | 52% |
| Portland, OR | -22% | 59% | 36% |
| San Jose, CA | -23% | 66% | 43% |
| Oakland, CA | -35% | 73% | 38% |
| Boise, ID | -36% | 58% | 22% |
| Santa Rosa, CA | -37% | 69% | 32% |
| Napa, CA | -40% | 69% | 29% |
| Sacramento, CA | -43% | 64% | 21% |
| Bend, OR | -43% | 79% | 36% |
| Miami, FL | -46% | 64% | 18% |
| West Palm Beach, FL | -46% | 69% | 23% |
| Palm Bay, FL | -47% | 62% | 15% |
| Sarasota, FL | -47% | 67% | 20% |
| Phoenix, AZ | -48% | 67% | 19% |
| Riverside, CA | -49% | 62% | 14% |
| Daytona Beach, FL | -49% | 57% | 8% |
| Yuba City, CA | -49% | 67% | 18% |
| Cape Coral, FL | -50% | 67% | 16% |
| Reno, NV | -51% | 86% | 35% |
| Salinas, CA | -51% | 66% | 14% |
| Port Lucie, FL | -52% | 68% | 16% |
| Stockton, CA | -57% | 82% | 25% |
| Modesto, CA | -58% | 84% | 26% |
| Las Vegas, NV | -60% | 78% | 18% |
| Merced, CA | -61% | 75% | 14% |
When you sort for total appreciation over the past 10 years (right column) you see that Denver and Boulder are neck and neck with 57% and 56% respectively. San Francisco is ranked in 3rd place with 52%.
| City | 2007-2012 | 20012-2017 | 10 Year Appreciation |
| Denver, CO | -5% | 62% | 57% |
| Boulder, CO | 2% | 55% | 56% |
| San Francisco, CA | -21% | 73% | 52% |
| Greeley, CO | -13% | 57% | 44% |
| San Jose, CA | -23% | 66% | 43% |
| Oakland, CA | -35% | 73% | 38% |
| Portland, OR | -22% | 59% | 36% |
| Bend, OR | -43% | 79% | 36% |
| Reno, NV | -51% | 86% | 35% |
| Santa Rosa, CA | -37% | 69% | 32% |
| Napa, CA | -40% | 69% | 29% |
| Modesto, CA | -58% | 84% | 26% |
| Stockton, CA | -57% | 82% | 25% |
| West Palm Beach, FL | -46% | 69% | 23% |
| Boise, ID | -36% | 58% | 22% |
| Sacramento, CA | -43% | 64% | 21% |
| Sarasota, FL | -47% | 67% | 20% |
| Phoenix, AZ | -48% | 67% | 19% |
| Miami, FL | -46% | 64% | 18% |
| Las Vegas, NV | -60% | 78% | 18% |
| Yuba City, CA | -49% | 67% | 18% |
| Cape Coral, FL | -50% | 67% | 16% |
| Port Lucie, FL | -52% | 68% | 16% |
| Palm Bay, FL | -47% | 62% | 15% |
| Salinas, CA | -51% | 66% | 14% |
| Merced, CA | -61% | 75% | 14% |
| Riverside, CA | -49% | 62% | 14% |
| Daytona Beach, FL | -49% | 57% | 8% |
Over time, our consistently good market has been fueled by limited building, a growing population, a strong and diverse economy and a location with a lifestyle where people want to live. Although I don’t expect that our market will continue to appreciate at it current pace, alas it is all a cycle, I do think that these factors will continue to make our market one of the most consistent in the nation. A great place to invest.

