
by Neil Kearney | Feb 13, 2013 | Boulder County Housing Trends, Statistics
Real estate sales in Boulder County continued the strong trend which began last year. Sales were up 27% in the first month of the year. Helping the sales numbers was a jump in available inventory. As of the end of January the number of homes on the market equaled last year. We will need to continue to add new listings to keep the market strong into the spring.
Interest rates have gone up a bit lately and I’m sure that has something to do with the early activity in the market. Also helping the market this January and February is unseasonably good weather. I noticed my bulbs are starting to sprout in the front yard. Where is winter this year? The attached slideshow shows the activity in the market for the month.
by Neil Kearney | Feb 8, 2013 | Boulder County Housing Trends, Statistics
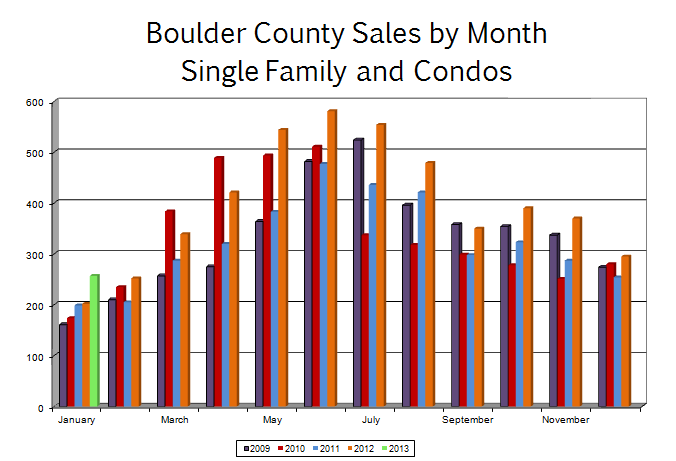
As I mentioned before, 2012 was a rebound year. The activity in the Boulder area real estate market was consistently strong throughout the year. If January is any indication, the trend is continuing. Sales in January were up 27% from last January. The first chart below shows the sales activity by month over the past five years.

Taking it one step further, the chart below shows the sales that closed in Boulder County on a weekly basis over the past four years. The purple line shows the closings over the four weeks of January and the strength in the market is clearly visable. Remember that the normal time between contract and closing is roughly 30 to 45 days so the buyers were picking out these homes in November and December.

Going forward here is what I see. I predict that we will continue to gain needed inventory (we are just about where we were a year ago) and the market will continue to be strong throughout the spring.
In the world of finance there is the Purchasing Managers Index. This is an indicator of economic activity that gives the world a good idea where the economy in the United States is heading. For the real estate market we have the Pending Sales Index. For our local market the best we can do is track the number of properties that are under contract. I have been doing this for quite some time. Every Thursday morning at 8:30 I run a saved search that gives me the number of new listings that have hit the market, the number of sales and the number of homes that have gone under contract. Using this I can get a sneak peak on how the numbers are going to look in the future. Right now (see below) we are in full gear and tracking a bit ahead of past years.


by Neil Kearney | Jan 29, 2013 | General Real Estate Advice, Statistics
 The year end statistics are coming out from various sources around the country and the broad consensus is that real estate had a surprisingly strong rebound year. Here are a few recent articles that summarizes the state of real estate across the union.
The premise of this article is that nobody predicted that 2012 would see real estate price appreciation. Here are a few excepts:
Looking back at the survey from December 2011shows that around 42 panelists, of the 94 that made their predictions public, saw prices declining on a year-over-year basis in 2012. The other 52 said prices would either rise or remain flat in 2012. Panelists base their home-price estimates on what they expect the Standard & Poor’s/Case-Shiller 20-city index to show.
Even the most bullish respondent in the late 2011 survey may have understated the actual 2012 home price gain, which won’t be tabulated and released by Standard & Poor’s until late February. Constance Hunter, the deputy chief investment officer of AXA Investment Managers, called for a 4.4% gain. In October, the Case-Shiller 20-city index stood 4.3% above last year’s level. (By March, Ms. Hunter revised down her forecast, calling for a gain of just 1.7% for 2012).
It is well known and well reported that the housing sector was a key force in the economic downturn. The sub-prime mortgage mess, foreclosures, home depreciation, construction stoppages were just some of the negative subjects related to real estate over the past few years.
For most people, their home is their biggest investment and with the value of that investment so goes their confidence. During the first six years of the 2000’s the United States saw a rapid rise in home prices (that’s what a bubble is called before it is recognized as such) and with that rise came a flooding tide of confidence that spurred the economy. During 2007 – 2011 just the opposite was true. With falling sales and falling prices confidence waned and everything from construction to appliance purchases suffered.
The economists surveyed also forecast that there will be just under 1 million housing starts this year — roughly matching the 28% rise in home building in 2012. Moody’s Analytics is forecasting much stronger growth — a 50% rise both this year and next year, which it estimates will create more than 1 million new jobs.
“There’s a lot of pent-up demand for housing, and very little supply,” said Celia Chen, housing economist for Moody’s Analytics. “As demand continues to improve, home builders have nothing to sell. They’ll have to build.” She said that growth in building will mean adding not just construction jobs, but also manufacturing jobs building the appliances and furniture needed in the new homes, which in turn drives overall consumption higher.
Home sales in Boulder County were up 23% during 2012. For us this was the most sales since 2007. Nationally sales increased by 9% last year and were the best (in terms of number of sales) since 2007. Here are a few excerpts from the article.
Sales are being helped by a combination of strong market fundamentals — near record low mortgage rates, lower unemployment and a rebound in home prices, all of which are bringing in buyers into the market who had been waiting for it to hit bottom. The mortgage rates and years of depressed home prices have also combined to create the most affordable housing market on record, according to the Realtors group.
And the Realtors are predicting strong sales should continue into 2013 and beyond. It has a forecast for 5.1 million existing home sales this year, and 5.4 million next year.
The “Realtors Group” refers to the National Association of Realtors.
The improved demand for homes in December led to the inventory of homes for sale to fall to 1.82 million homes on the market, the lowest supply since January 2001. One factor in tightening supplies is a drop in foreclosures and other distressed home sales, which made up only 24% of home sales in December compared to 32% a year ago. The tighter supply, and the drop in distressed sales, have helped to lift home prices so that the median sales price for the year rose to $176,600, up 6.3% from 2011. That’s the biggest gain in prices in since the bubble year of 2005.
It’s good to see that I’m not the only one expecting a strong year this year. As I predicted last year, we were one of the first markets to recover and our recovery was stronger than most.
by Neil Kearney | Jan 21, 2013 | Boulder County Housing Trends, Statistics
We take pride in following and reporting on the local real estate market on an ongoing basis. The end of the year is a great time to pull together the trends and give the real estate market a comprehensive look. The Kearney Report contains sales data across Boulder county and includes charts and explanations about; total sales, median prices, sales by price range, sales by zip code and sales by type.
2012 was a good year. Sales increased by 23%, prices increased and inventory of available homes decreased. The 19 page report quickly lets the reader understand the local real estate market. Our goal at Kearney Realty is to empower our clients by giving them solid information from which they can make a good decision. Click here to view the entire report. No login required!
by Neil Kearney | Jan 17, 2013 | Boulder County Housing Trends, Statistics
Since the trap door fell out on the national economy, the housing market has been wallowing in a dark cellar looking for sparks of optimism from which to ignite. This past year the sparks caught and the housing market began it’s path toward recovery. Today I will begin highlight a few of the more interesting statistics for the year. To get a full view of what is happening in the different market segments, I encourage you to get a copy of The Kearney Report (to be released soon) and study the graphs and explanations included therein.

The number of residential properties that sold in Boulder County was up 23% during the year. On a monthly basis, each months sales eclipsed the sales of the same month in 2011 so it was a consistent recovery not one weighted to either end of the year. After five years of stagnant to slightly negative appreciation we saw once again prices of homes rising. This was especially true as we closed the year. Many factors go into home price trends but the largest factor locally was basic supply and demand. As the year progressed the activity in the market remained strong but the number of homes on the market dwindled. By the end of the year the number of active homes on the market was down to about half as many as were on the market at the same time in 2009. This competition for good listings is leading to multiple offers and upward pressure on prices.

Low interest rates are definitely a driving factor in buyer demand. The affordability of homes (total monthly outlay compared to income) is at a historically high rate. That is when a buyer purchases a home now they can afford more home because the prices have not been rising with inflation and the interest charges are way down. Add to this the tight rental market where rents have been rising and good properties have been hard to find, and you get a really strong environment for buying homes.
The market is off to a strong start this year. All indications show that we will have good buyer demand. The only unknown variable is if we will have an ample supply of homes on the market. If you have been thinking about selling but have been putting it off, we would love to explore that possibility with you and let you know if it makes sense for you.


