I get curious about the real estate market too. I have a good view of what is going on from my “window” on the market. But sometimes I like to confirm what is going on by looking at the numbers. My feeling is that the market has been pretty slow since the beginning of August. The numbers confirm that it has been steady but slow with numbers comparable to last year at this time.
As I have stated recently when looking at the month end statistics, total sales are down approximately 7% but we have made big strides over the past two months in erasing that deficit entirely. Today I want to segment the market a bit more and look at the two statistics that I think best represent current activity in the market; under contract percentage and absorption rate (or inventory in months). I will look at each of these statistics over six price ranges and seven different geographic areas throughout Boulder County. If you are curious which price ranges or areas are selling the best, your curiosity will soon be quenched.
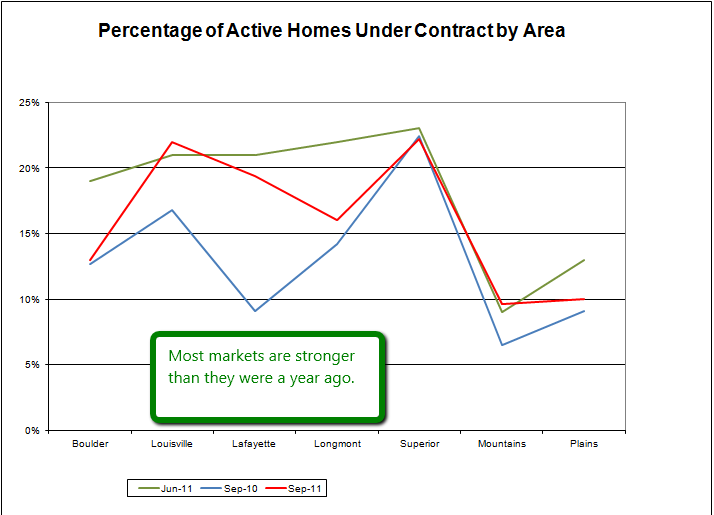
Let’s first look at under contract percentage. It is simply a quick ratio of the number of properties currently under contract to the total number of listings available. Here is a graph showing under contract percentage by area.
Compared to last year the under contract percentages are stronger in 5 of the 7 markets and almost equal in Boulder and Superior.
Under contract percentage arranged by price range is always interesting because the real estate market in Boulder County shows an almost linear increase as the price range rises. Or to say it another way, the market is more fluid in the lower price ranges and less liquid as prices rise. Here is how this looks.
Under Contract Percentage by Price
The numbers this year are very similar to last year at this time but are slightly higher which is good. The percentages range from 18% for properties listed up to $250,000 and 4% for those listed for more than $1.5 million. The lower price ranges have a balanced market and the upper price ranges show an over supply.
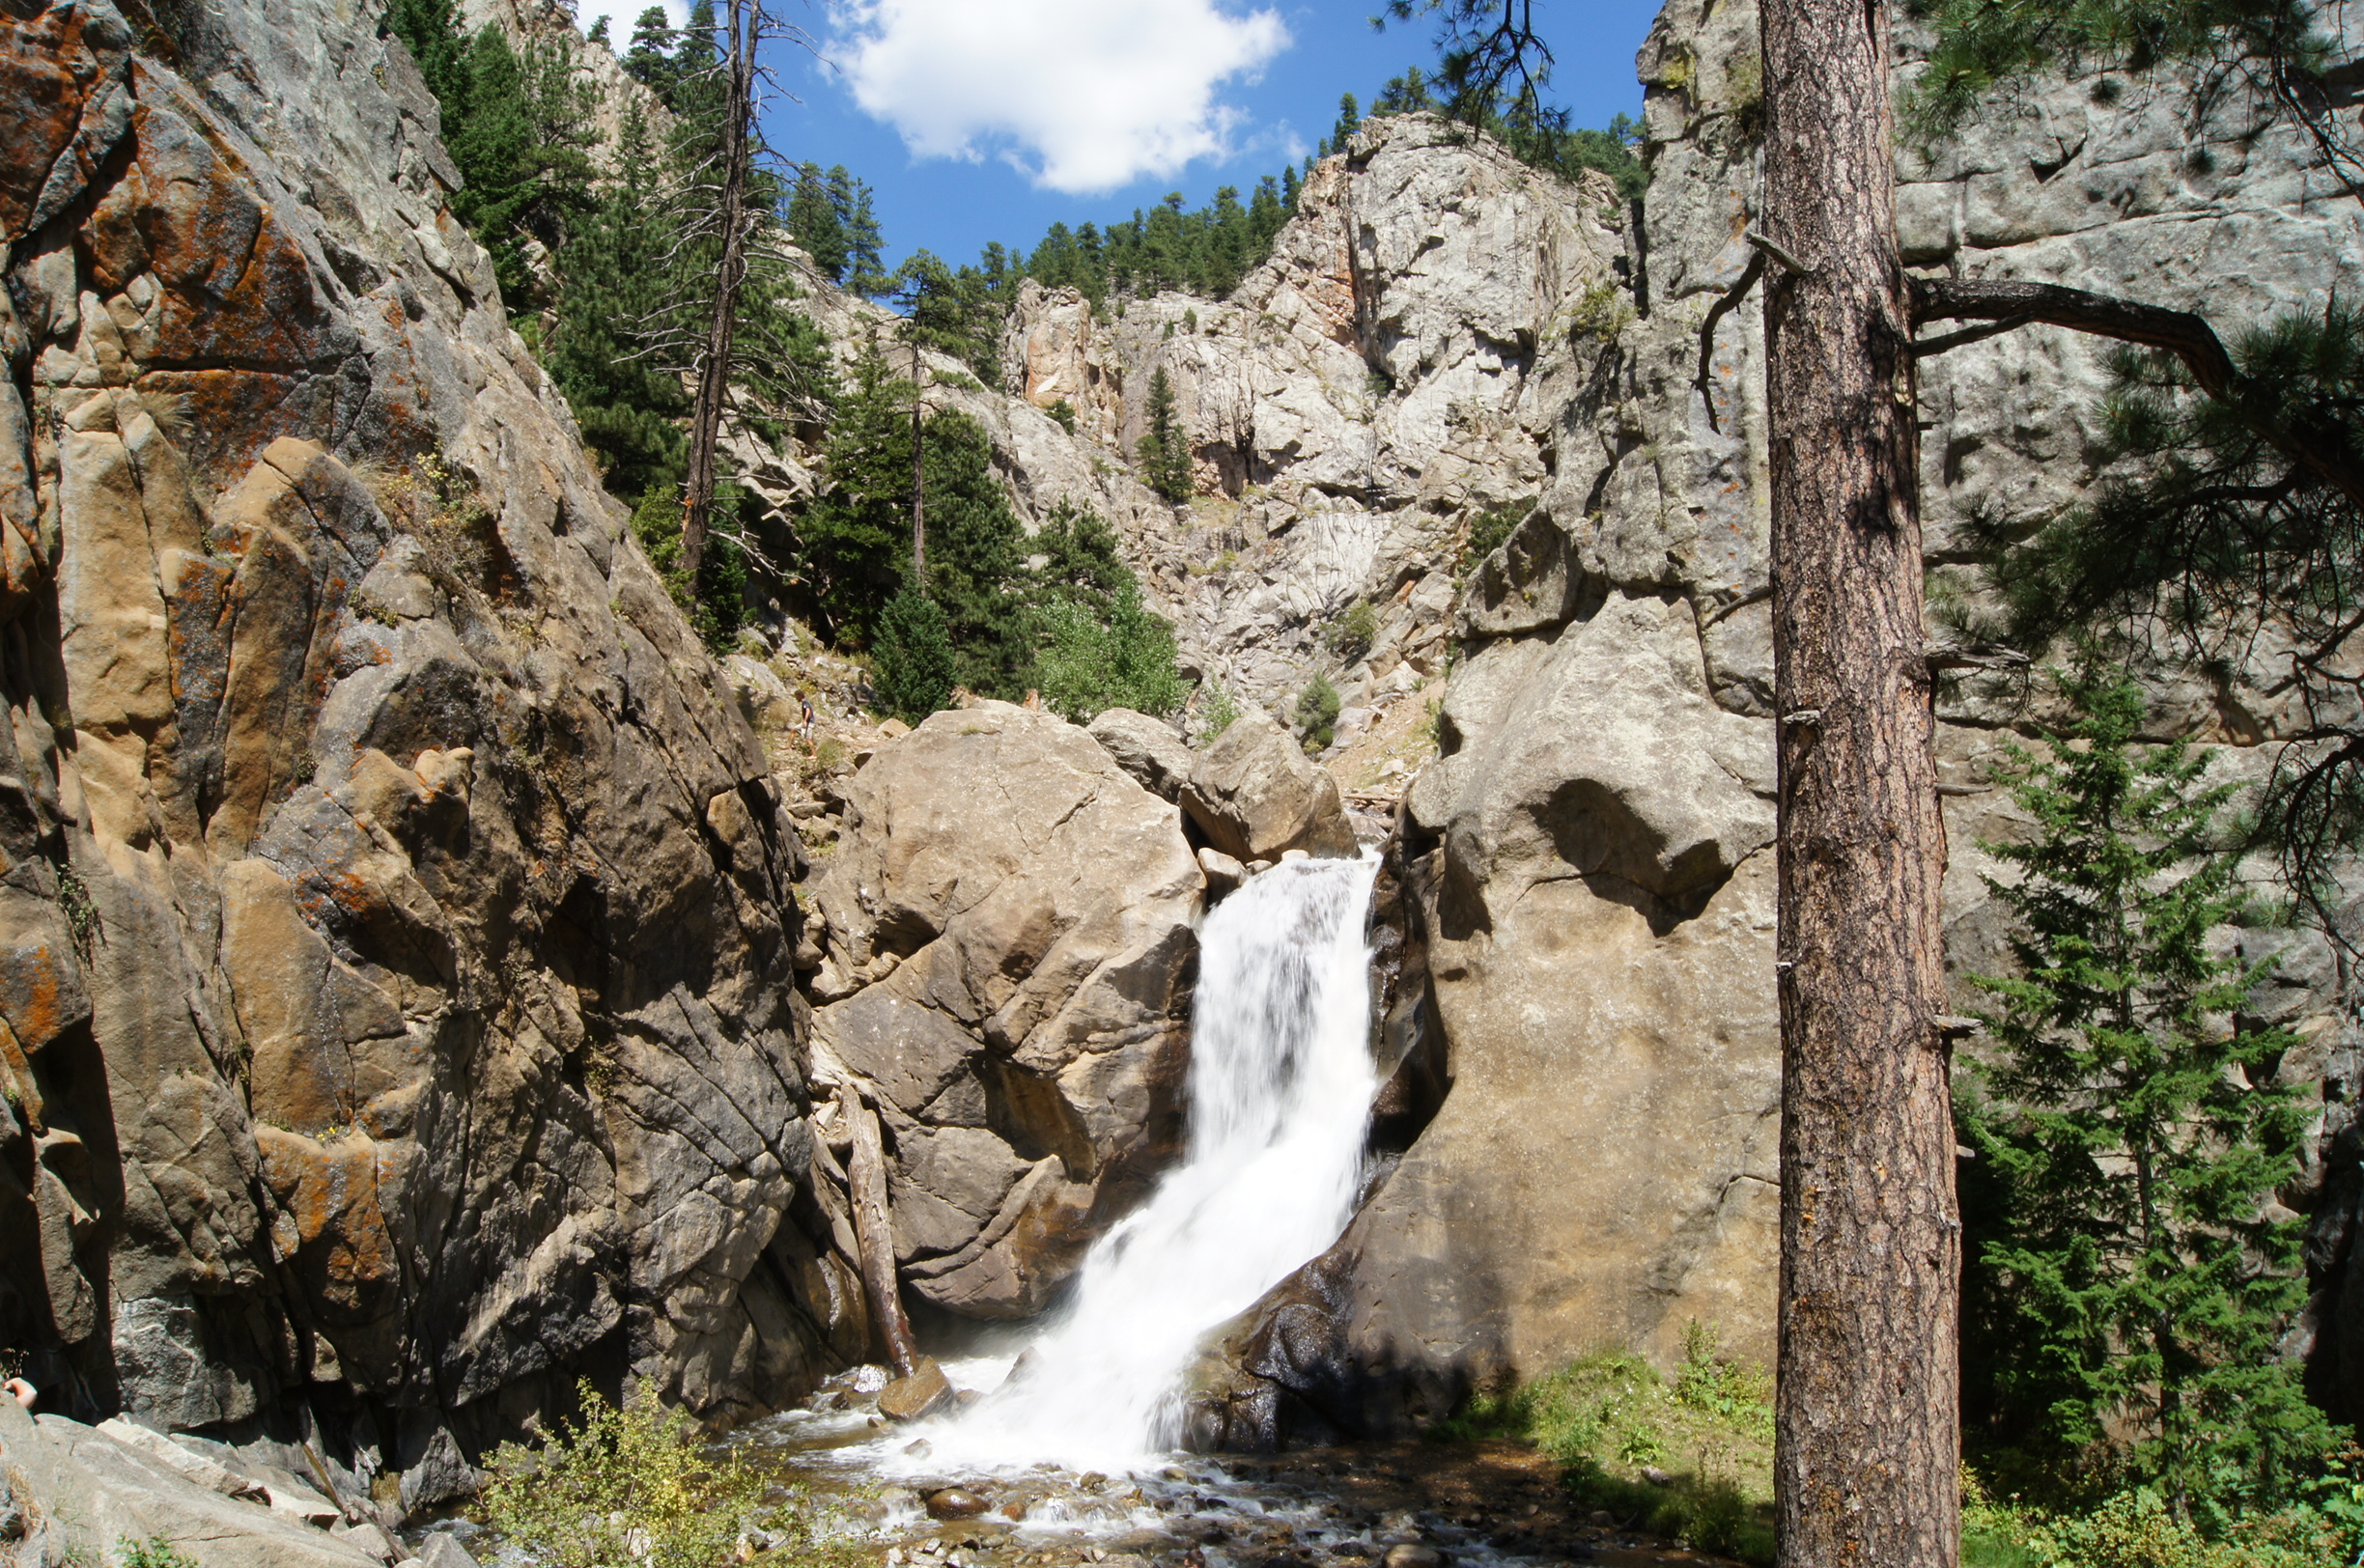
In my job as a Realtor I am out driving around Boulder County every day. Most of the time I’m on a tight schedule and am running from one thing to the next. Recently, I was driving to Nederland to take photos of my new land listing at 79 Wildewood Drive and I passed the sign for Boulder Falls and realized that I had never stopped to see it. I am a Boulder native so that means many missed opportunities. So I stopped and shot a few photos and this video.
Near the end of the video a person stands just to the left of the top of the falls. This gives a good perspective of the size of the falls. Hiking of the trail is strictly prohibited so don’t do what this guy was doing.
Here is some information on the falls from the City of Boulder website:
Boulder Falls Trail is closed from November 1 through April 30.
Boulder Falls is located 11 miles west of Boulder, on the north side of Boulder Canyon Drive (SR 119) between Boulder and Nederland. It consists of five acres of mining claims that were given to the City of Boulder by Charles G. Buckingham, president and co-founder of Buckingham Brothers Bank (now Norwest Bank). Buckingham had held a U.S. Patent since 1881 on the American Mill site that included the Falls. He donated it to the City of Boulder for recreational purposes in 1914, hence “saving this beautiful spot from the encroachment of the great tungsten boom.”
For many years the Boulder Falls (sometimes referred to as the “Yosemite of Boulder Canyon”), was the popular destination for picnic groups. Carryalls brought visitors up for a visit to the Falls, especially after the narrow gauge railroad washed out in the great flood of 1894. When the railroad was rebuilt four years later, stage and tourist travel was diverted and the popularity of Boulder Falls declined.
Today, Boulder Falls receives heavy visitation by tourists heading to the high country from Boulder. Boulder Falls is quite lovely and well worth the brief stop for a look at the cascading water. There is a large parking area just across SR 119 from the Falls; please cross the road with care to access the short trail that leads to a viewing area. Visitors are required to stay on the main path that ends at a viewpoint just below the falls. Here you will have an excellent view of the Falls, forming where North Boulder Creek plunges approximately 70 feet to enter Middle Boulder Creek. For your safety, the area beyond the viewpoint has been closed. The rocks and water past this point are deceptively dangerous, and several people have been killed while scrambling around the falls.
“Picture Rock” is a large gray boulder located just next to the road at Boulder Falls, appropriately named for the large round hole which has framed the faces of countless visitors as they posed for photographs here. The rock eroded naturally to produce the hole and was hauled up from Boulder Creek when the “new” highway was built in the 1940s.
Real estate sales in Boulder County continue to hold forward momentum. Early in the year sales were down as much as 22% from last year YTD. Now we are just behind by 7% overall. During August sales were 32% stronger than they were a year ago during August. This is a good sign that the momentum we have been riding through the summer is continuing.
Here are some quick facts:
Total inventory is within 1% of where we were at this time last year. No stockpiling of listings here. Just ask an active buyer. They wish there was more to see. If you have been considering listing your home September might be a great time. Call me to discuss.
Under contract percentage at the end of August was 15%.
Sales under $500,000 over the past 6 months have decreased 7% from 2010. (1,902 sales)
Sales $500,000 – $1,000,000 over the past 6 months have decreased 1% from 2010. (399 sales)
Sales over $1,000,000 over the past 6 months are exactly the same as they were last year. (79 sales)
Please click on the slideshow below to view the monthly statistics graphically. For best viewing click on full screen in the lower right corner.
Markets are fluid. Sometimes they go up, sometimes they go down. We have learned over the past five years that when a market goes up significantly most likely they will be headed down very soon.
According to FHFA.gov here are the hottest real estate markets in the country:
Bismarck, ND 6.09%
Blacksburg-Christiansburg-Radford, VA 1.79%
Florence-Muscle Shoals, AL 1.69%
Honolulu, HI 1.67%
Springfield, IL 1.52%
State College, PA 1.35%
Waterloo-Cedar Falls, IA 1.23%
Charleston, WV 1.23%
Lincoln, NE 1.13%
Fayetteville, NC 1.1%
Sioux Falls, SD 0.97%
Owensboro, KY 0.8%
Buffalo-Niagara Falls, NY 0.58%
Fargo, ND-MN 0.51%
Pittsburgh, PA 0.49%
Anchorage, AK 0.48%
Fort Smith, AR-OK 0.45%
Kennewick-Pasco-Richland, WA 0.26%
San Antonio-New Braunfels, TX 0.24%
Greeley, CO 0.17%
Note: Boulder County ranks 81st at -2.17%
Here are the bottom 20 areas that have had the worst home price depreciation over the past year:
Boise City-Nampa, ID -16.13%
Las Vegas-Paradise, NV -15.98%
Phoenix-Mesa-Glendale, AZ -14.98%
Punta Gorda, FL -13.97%
Medford, OR -13.51%
Prescott, AZ -12.94%
St. George, UT -12.41%
Redding, CA -12.36%
Gainesville, GA -12.23%
Coeur d’Alene, ID -12.11%
Hagerstown-Martinsburg, MD-WV -11.87%
Lakeland-Winter Haven, FL -11.76%
West Palm Beach-Boca Raton-Boynton Beach, FL (MSAD) -11.61%